
Key Takeaways
-
Monad (MON) has dropped nearly 41% over the past two months but is showing early signs of stabilization.
-
Price action suggests a potential double bottom pattern forming near the $0.018 support zone.
-
Buyers have repeatedly defended the same support level, hinting at fading selling pressure.
-
A move above the 50-day moving average could strengthen the short-term bullish outlook.
-
A confirmed breakout above the $0.02970 neckline may open the door for a stronger recovery rally.
Monad (MON), the native token of the Monad Layer-1 blockchain, has been under pressure in recent weeks. The token is down roughly 41% over the past 60 days, driven by a slowdown in TVL growth and a decline in application-level revenue across the ecosystem.
However, sentiment may be starting to shift. MON posted a 12% bounce today, and more importantly, its price structure on the daily chart is beginning to show early signs of a bullish reversal — suggesting the downside momentum could be losing steam.
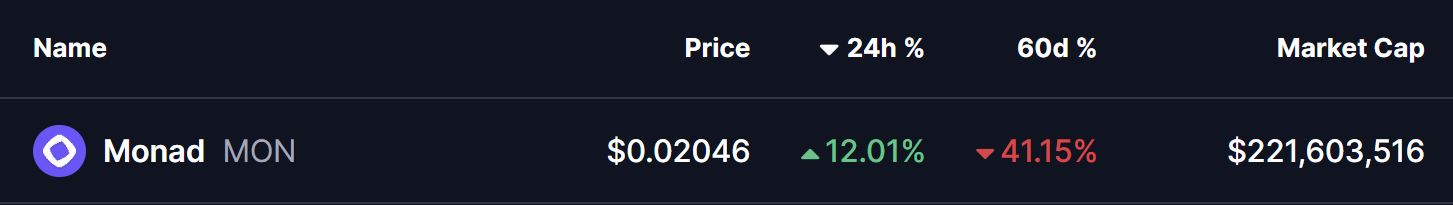
Source: Coinmarketcap
Double Bottom Pattern in Play
On the daily timeframe, MON appears to be forming a potential double bottom pattern, a classic bullish reversal structure that often develops near the end of extended downtrends.
The first bottom was formed when MON dropped toward the $0.018 support zone, followed by a rebound that carried price back toward the neckline resistance near $0.02970. That recovery attempt was rejected, sending MON back down to retest the same support level.
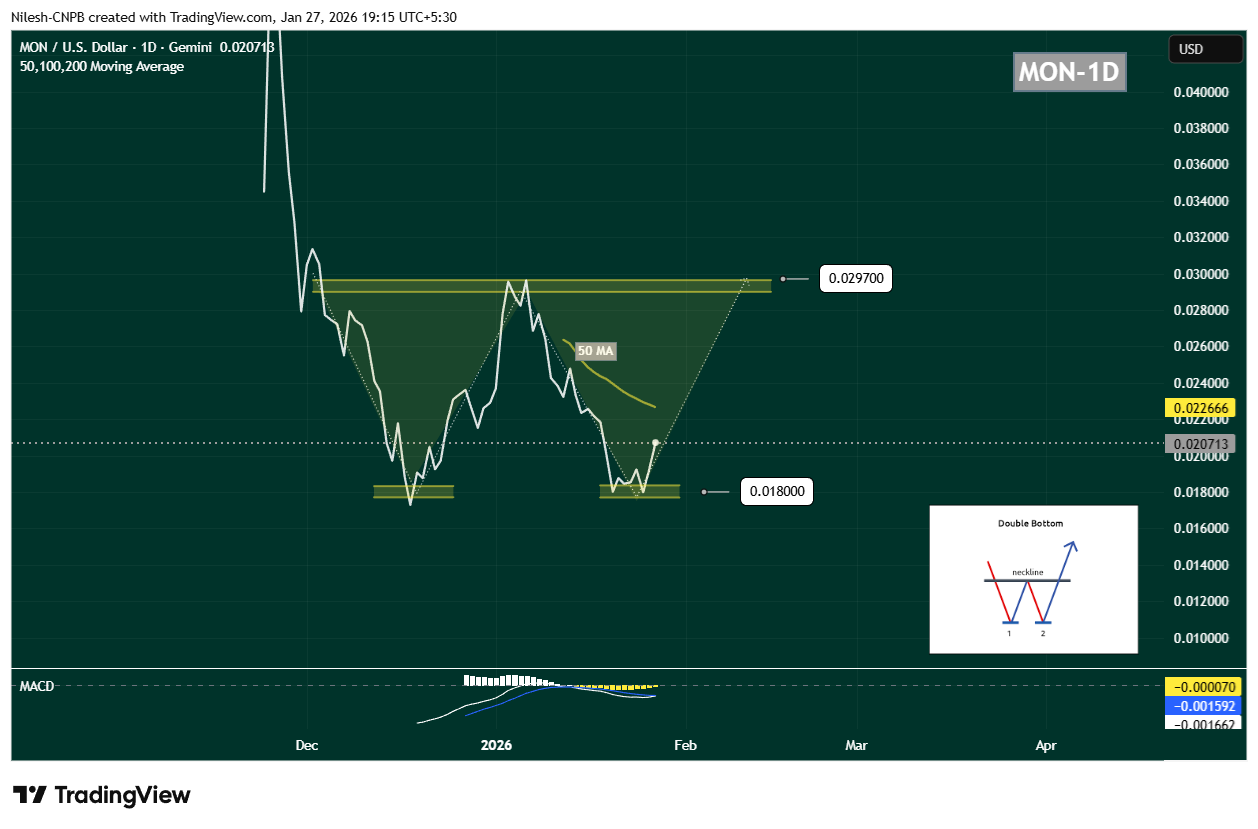
Monad (MON) Daily Chart/Coinsprobe (Source: Tradingview)
What’s notable this time is buyer behavior. Once again, demand emerged around $0.018, preventing a breakdown and forming the second bottom of the structure. MON is currently trading near $0.02071, indicating that selling pressure may be fading.
Momentum indicators are starting to support this view. The MACD is showing early signs of a potential bullish crossover, often seen as an initial signal that downside momentum is weakening and buyers may be preparing to step back in.
What’s Next for Monad (MON)?
For this bullish setup to gain credibility, MON needs to reclaim the 50-day moving average, which is currently positioned near $0.02266. A sustained move above this level would signal a shift in short-term momentum and improve the probability of a recovery rally.
If buyers manage to push price back toward the $0.02970 neckline, the market will be watching closely. A decisive breakout above this resistance, ideally followed by a successful retest, would confirm the double bottom pattern and open the door for a stronger upside move.
On the downside, the $0.018 support zone remains the most critical level to defend. A breakdown below this area would invalidate the bullish structure and likely expose MON to another leg of downside or extended consolidation.
Bottom Line
Despite recent weakness, MON’s technical structure is starting to look constructive. The repeated defense of identical lows, the emergence of a double bottom pattern, and improving momentum signals suggest that Monad could be approaching a potential turning point.
If key support continues to hold and the token reclaims its short-term moving averages, MON may be setting the stage for a recovery phase — especially if broader market conditions stabilize in the days ahead.
Disclaimer: The views and analysis presented in this article are for informational purposes only and reflect the author’s perspective, not financial advice. Technical patterns and indicators discussed are subject to market volatility and may or may not yield the anticipated results. Investors are advised to exercise caution, conduct independent research, and make decisions aligned with their individual risk tolerance.
About Author: Nilesh Hembade is the Founder and Lead Author of Coinsprobe, with over 5 years of experience in the cryptocurrency and blockchain industry. Since launching Coinsprobe in 2023, he has been providing daily, research-driven insights through in-depth market analysis, on-chain data, and technical research.
Disclaimer: The information on this page may come from third parties and does not represent the views or opinions of Gate. The content displayed on this page is for reference only and does not constitute any financial, investment, or legal advice. Gate does not guarantee the accuracy or completeness of the information and shall not be liable for any losses arising from the use of this information. Virtual asset investments carry high risks and are subject to significant price volatility. You may lose all of your invested principal. Please fully understand the relevant risks and make prudent decisions based on your own financial situation and risk tolerance. For details, please refer to
Disclaimer.
Related Articles
Bitcoin Rebound's Key Depends on Iran's Stance, Ceasefire News Sways Market Risk Appetite
US-Iran ceasefire reports trigger market volatility, Bitcoin rebounds in the short term. Analysts believe Iran's influence has transcended military operations, with markets sensitive to ceasefire expectations. A ceasefire would boost risk assets, while continued conflict would limit Bitcoin's upside potential. Investors need to monitor Iran's stance.
GateNews1m ago
Nvidia's stock price is under pressure at $175, with technical and options signals indicating downside risk
Nvidia's stock price has been hovering near $175 recently, with consecutive declines and technical indicators showing intensifying selling pressure. Fund flows and options markets are both leaning bearish, with $171 serving as a key support level. A break below this level could lead to further downside exploration, and investors need to monitor market movements.
GateNews6m ago
Three Major "Narrative Barriers" May Limit Strategic Bitcoin Expansion: Centralization Risks, Quantum Threats, and Diversification Concerns
Strategy is poised to become the largest corporate bitcoin holder, but faces concentration risk, quantum computing threats, and portfolio diversification issues that could impact its ability to increase holdings. Analysts point out these are key areas of concern, yet there are no signs indicating they will trigger large-scale risk.
GateNews8m ago
TAO Surges 18% Back to $300: Short Squeeze Ends, Key Resistance Level May Decide Next Direction
Bittensor (TAO) price rebounded strongly to $308 on March 25, with an 18% gain. This rally was primarily driven by short squeezes, but inflows showed weakening momentum, indicating a bearish divergence. The current price is approaching key resistance, and the subsequent trend will depend on whether it can break through $310 and the entry of spot buying pressure.
GateNews9m ago
Mining 1 Coin Loses $20,000! Bitcoin Miners Flee En Masse, "Mining Difficulty" Plummets 7.8%
Bitcoin mining industry is facing severe challenges as coin prices decline and energy costs rise, with mining costs soaring to $88,000, causing miners to lose nearly $20,000 per bitcoin mined. International oil prices and geopolitical risks intensify financial pressure on miners. Hash rate decline and extended block time indicate miners are exiting the market, driving a sell-off wave that further impacts price structure. To survive, mining companies are turning to AI and high-performance computing to seek new revenue streams.
区块客28m ago
PEPE Price Slides as Weak Momentum Signals Further Downside
The Pepe token displays weakening momentum with bearish sentiment prevalent in short-term trading. Oversold conditions fail to ignite recovery, indicating weak demand and cautious trader behavior, while price pressures near the lower Bollinger Band highlight ongoing downside risks.
CryptoFrontNews32m ago
