
The BTC price doesn’t move in a bubble. And when geopolitical tension starts heating up, Bitcoin usually acts a lot less like “digital gold” and a lot more like what it really is in today’s market: a risk asset.
That’s basically the point analyst Ardi is making. When conflict escalates, big money doesn’t rush into crypto for safety. Institutions usually do the opposite. They cut risk, sell anything speculative, and rotate into the classic safe zones like oil, gold, treasuries, and cash.
So if tensions between Iran and the US intensify, the first real warning sign probably won’t come from crypto Twitter. It’ll come from crude oil.
- What the Chart Shows: Oil Moves First, BTC Reacts
- Why War Isn’t Automatically Bullish for Bitcoin
- An Oil Spike Could Drag BTC Lower
- If Oil Stays Contained, BTC Can Stabilize
What the Chart Shows: Oil Moves First, BTC Reacts
The chart shared by Ardi makes the relationship pretty clear. Oil prices are shown in red, and the BTC price is the black candlestick trend.
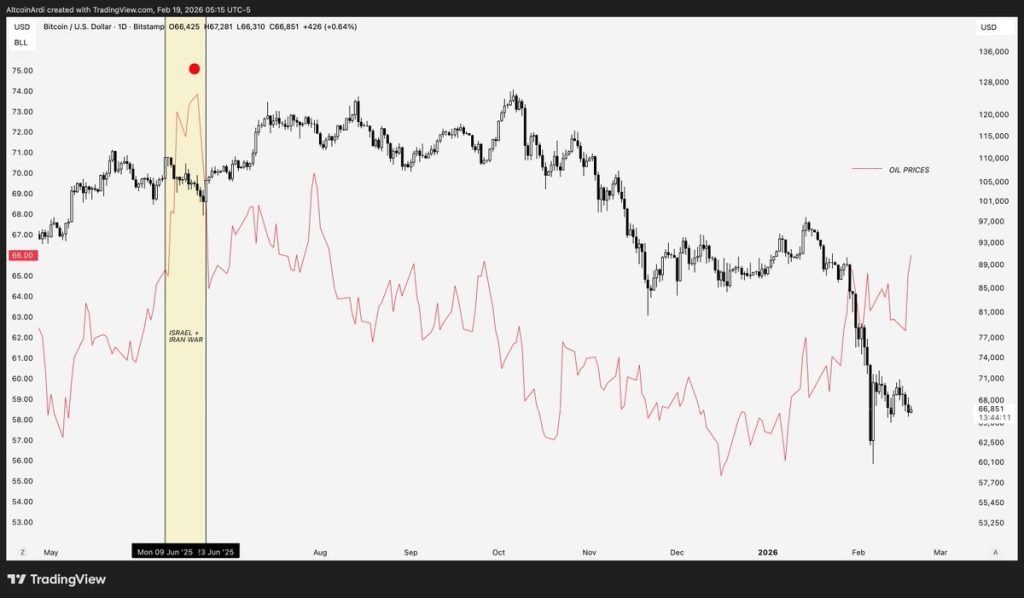
Source: X/@ArdiNSC
Back in June 2025 during the Israel-Iran conflict window, oil jumped from the mid-$60s up into the low-$70s. That spike happened first. Bitcoin was sitting above $105K, but once oil started ripping higher, the BTC price dropped fast into the mid-$90Ks.
That sequence matters a lot. Oil didn’t follow Bitcoin. Bitcoin followed oil. And the chart also shows the broader weakness into early 2026, where the BTC price has stayed under pressure as oil volatility remained elevated. That’s what risk-off looks like in real time.
Why War Isn’t Automatically Bullish for Bitcoin
A lot of people in crypto love the idea that war equals chaos, and chaos automatically sends Bitcoin higher. But markets don’t really work that way.
Bitcoin still trades in the same bucket as tech stocks and other high-risk assets. When geopolitical stress spikes, funds don’t suddenly treat BTC like a commodity hedge. They sell first, reduce exposure, and move into safer assets.
Oil reacts instantly because it’s tied directly to supply disruption. Conflict in the Middle East can threaten energy flows overnight. The BTC price reacts differently, mostly through liquidity leaving speculative markets.
An Oil Spike Could Drag BTC Lower
The bearish setup is pretty simple. Crude is sitting near $65 right now. If Iran escalates and oil starts pushing toward $75 or $80, institutions will likely flip into full risk-off mode.
In that scenario, the BTC price could easily see another sharp leg down, similar to what happened in June 2025, or even worse. If key support levels break, a deeper flush becomes very realistic. The market usually doesn’t calm down until oil volatility cools off. Selling pressure often continues until crude finally tops out.
Analyst Warns Against Being Bullish on Crude Oil, Points to Potential Dangers Ahead_**
If Oil Stays Contained, BTC Can Stabilize
The bullish case depends on oil not breaking out. If crude stays rangebound and tensions don’t disrupt supply, risk markets can breathe again.
That gives the BTC price room to stabilize, especially if buyers step in at major support or macro conditions improve. Bitcoin doesn’t need peace headlines as much as it needs oil to stop flashing danger.
The takeaway is simple: oil is often the lead indicator during geopolitical shocks. If crude starts running, the BTC price usually isn’t far behind on the way down.
Disclaimer: The information on this page may come from third parties and does not represent the views or opinions of Gate. The content displayed on this page is for reference only and does not constitute any financial, investment, or legal advice. Gate does not guarantee the accuracy or completeness of the information and shall not be liable for any losses arising from the use of this information. Virtual asset investments carry high risks and are subject to significant price volatility. You may lose all of your invested principal. Please fully understand the relevant risks and make prudent decisions based on your own financial situation and risk tolerance. For details, please refer to
Disclaimer.
Related Articles
BTC drops 0.62% over 15 minutes: exchange net inflows intensify and short-term arbitrage converges to trigger volatility
From 18:00 to 18:15 on April 9, 2026 (UTC), the BTC price return recorded -0.62%, closing in the range of 71857.8 to 72375.1 USDT, with a trading range of 0.72%. Market attention was notably elevated, volatility intensified, and capital moved quickly within a short period. Overall market sentiment has become more cautious, and investors’ willingness to trade in the short term has increased.
The main driving force behind this abnormal move is an increase in net inflows to BTC exchanges during the anomaly window; the 10-minute net flow reached 755.92 BTC, indicating that some investors chose to transfer funds to exchanges to seek arbitrage opportunities in the midst of the volatility issue
GateNews49m ago
BTC 15-minute pump 0.55%: Large on-chain funds inflows and options positioning resonate to lift spot prices
2026-04-09 17:00 to 2026-04-09 17:15 (UTC), the BTC spot market saw a rapid spike with a +0.55% return. The price range was 72,063.9 to 72,518.5 USDT, and the full-period amplitude reached 0.63%. This upswing coincided with rising market attention; volatility clearly intensified, drawing funds into short-term trading in a mix of cautious sentiment and localized increased volume.
The main driving force behind this move was concentrated inflows to exchanges from on-chain large transfers, which pushed up spot market buy orders in a short time. Data shows that, in the past 24 hours, on-chain BTC transfers
GateNews1h ago
Mainstream CEX and DEX funding-rate displays suggest an increasingly bearish market sentiment
On April 10, the Bitcoin price broke through $72k again. According to Coinglass data, the funding rates on major trading platforms show that the market’s bearish sentiment is strengthening. Funding rates are used to balance the contract price with the asset price; a rate below 0.005% indicates that the market is broadly bearish.
GateNews2h ago
Over the past 1 hour, forced liquidations across the entire market totaled $101 million, including $80.39 million in BTC liquidations.
Gate News message, on April 9, CoinGlass data shows that over the past 1 hour, liquidations across the entire network totaled $101 million, including $97.07 million from short liquidations and $3.54 million from long liquidations. In addition, the liquidation amount for BTC reached $80.39 million, while the liquidation amount for ETH reached $11.79 million.
GateNews3h ago
CME Group BTC futures liquidity falls to a 14-month low, with basis trading failures triggering institutional capital outflows
The Chicago Mercantile Exchange’s Bitcoin futures market has continued to weaken. In March 2026, the daily average open interest fell to $7.2 billion, hitting a new low since February 2024, and has been declining for five straight months. The main reason is the large-scale unwinding of basis trades, which eliminated the arbitrage spread and caused leveraged capital to exit.
GateNews3h ago
