
XRP has been underperforming since January, unable to effectively attract market funds. Currently, its trading price is below the 50-day moving average (1.49 USD) and the 200-day moving average (2.17 USD), both of which have turned into resistance levels. However, the spent output profit ratio (SOPR) and net unrealized profit/loss (NUPL) are simultaneously releasing historic signals indicating a bottom formation.
On-Chain Bottom Signals: Interpretation of SOPR and NUPL Data
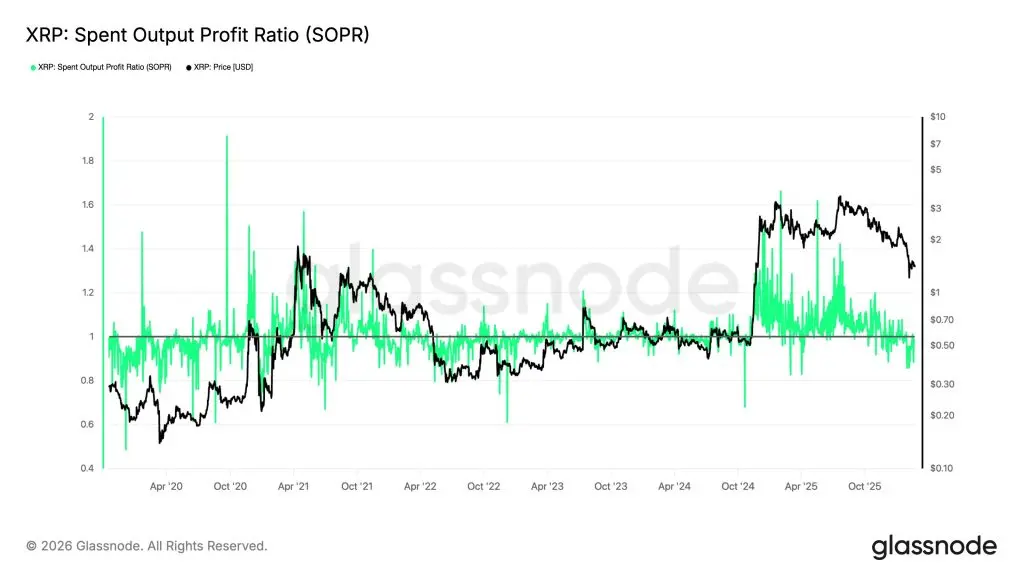 (Source: Glassnode)
SOPR is approaching the critical threshold of 1.0. Historically, when SOPR nears 1, it indicates that most profit-taking operations in the market are nearing zero profit, meaning sellers are no longer able to realize significant gains—this is often a precursor to the end of profit-taking cycles and usually appears before bottom structures form.
NUPL data also shows late-stage signals, suggesting that the most severe panic selling pressure may be nearing its end. NUPL measures the overall market’s unrealized gains and losses; when this indicator enters the “capitulation” or “fear” zone, it often corresponds to mid-term lows in history.
It should be noted that these indicators suggest probabilistic bottom characteristics, not definitive reversal signals. On-chain data describe the current market structure but cannot predict the timing or catalysts for actual rebounds.
Technical Perspective: $1.51 is the Short-Term Bull-Bear Divide
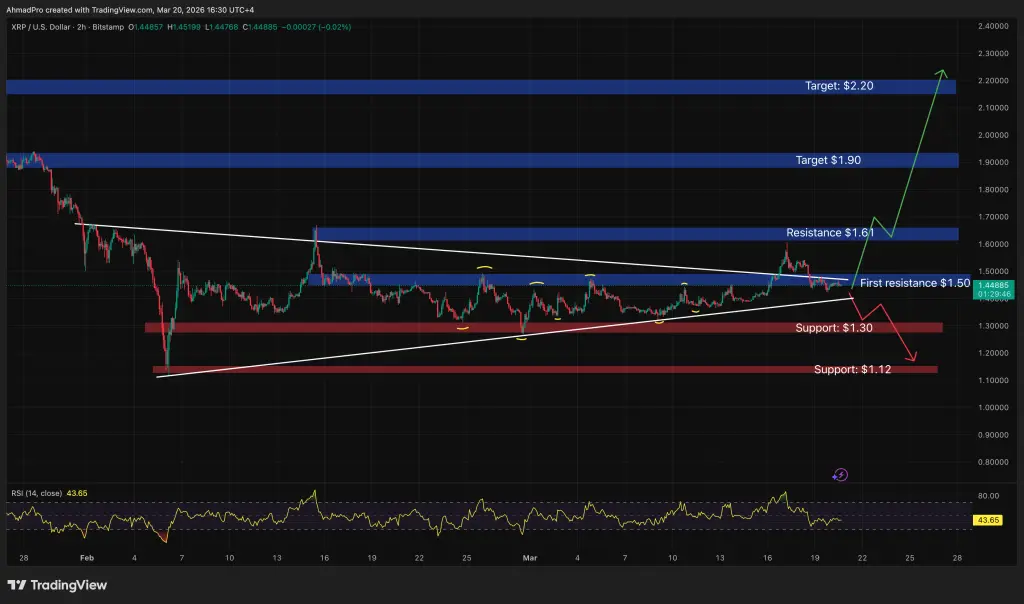 (Source: Trading View)
From the chart structure, XRP’s RSI currently hovers between 48 and 50, in a fully neutral zone, with no oversold bounce momentum or overbought pullback pressure. This indicates high market uncertainty, awaiting a clear catalyst for direction.
Key Short-Term Technical Levels for XRP
- $1.51: Resistance at the descending trendline. A successful breakout targets $1.90 in the short term.
- $1.49: 50-day moving average, now acting as short-term resistance.
- $2.17: 200-day moving average, an important medium-term resistance zone.
- $1.30: If broken, potential support down to $1.11.
- $1.60: According to Polymarket data, there is a 41% chance that the price slowly declines to this level before March 30.
Currently, bears dominate the short-term trend, but bulls only need a daily close above $1.51 to regain control of the narrative.
Market Data Forecast: How the Market Prices XRP’s Rebound Probability
Polymarket’s derivatives market data offers an objective perspective. The forecast shows only a 5% chance that XRP will return to $2 before April. The most probable scenario (41%) is a slow decline to $1.60 before March 30, accompanied by oscillations.
This data indicates that the market remains cautious about a short-term strong rebound for XRP. Even if on-chain indicators suggest bottom formation, a large-scale capital inflow requires clear policy or ecosystem catalysts. The core logic of today’s XRP news is: the structure is improving, but the pace of improvement may be much slower than expected.
FAQs
What does the SOPR signal today specifically mean for XRP?
SOPR (Spent Output Profit Ratio) approaching 1.0 indicates that the average profit when holders sell is near zero, meaning profit-taking momentum is waning. Historically, when SOPR hits or falls below 1.0, it often precedes the establishment of a bottom, but it does not guarantee an immediate rebound.
Where are the most critical technical levels to watch for XRP now?
$1.51 is the key short-term support/resistance level. A daily close above this could extend bullish momentum toward $1.90. Falling below $1.30 might test support at $1.11. Currently, the market is in a range-bound state without clear directional catalysts.
Why does Polymarket give only a 5% chance for XRP to return to $2?
Polymarket’s prediction market aggregates collective trader judgment. The 5% probability reflects the market’s view that, under macro uncertainties (geopolitical tensions, interest rate expectations), XRP is unlikely to break through multiple resistance levels and reach $2 in the short term. This data is a statistical reflection of market sentiment, not a definitive forecast.
Disclaimer: The information on this page may come from third parties and does not represent the views or opinions of Gate. The content displayed on this page is for reference only and does not constitute any financial, investment, or legal advice. Gate does not guarantee the accuracy or completeness of the information and shall not be liable for any losses arising from the use of this information. Virtual asset investments carry high risks and are subject to significant price volatility. You may lose all of your invested principal. Please fully understand the relevant risks and make prudent decisions based on your own financial situation and risk tolerance. For details, please refer to
Disclaimer.
