
The Midnight price jumped more than 7.6% over the last 24 hours, pushing up toward $0.047, and honestly, there’s no huge news catalyst here. No partnership announcement, no exchange listing, no protocol upgrade. Just a good old-fashioned technical bounce from levels that were getting kind of ridiculous.
The move pushed the price from $0.044 up to $0.047 in a single candle, and the volume was there to back it up: 225 million NIGHT changing hands, just below the predicted volume of 262 million. That’s legit participation, not a low-liquidity pump.
Analyst Says Hedera (HBAR) Is Worth Watching Again – Here’s the Reason_**
- What the NIGHT Chart Is Showing
- The Bigger Picture
- What Comes Next for NIGHT
What the NIGHT Chart Is Showing
Looking at the 4-hour chart, the NIGHT price is now sitting around $0.0473, having broken above the $0.046 resistance that had been capping it for the past few days.
The OBV is sitting at 13.23 billion, just above its moving average, which indicates that volume is actually supporting the move. When the OBV is rising with price, it’s usually a sign that the move has legs.
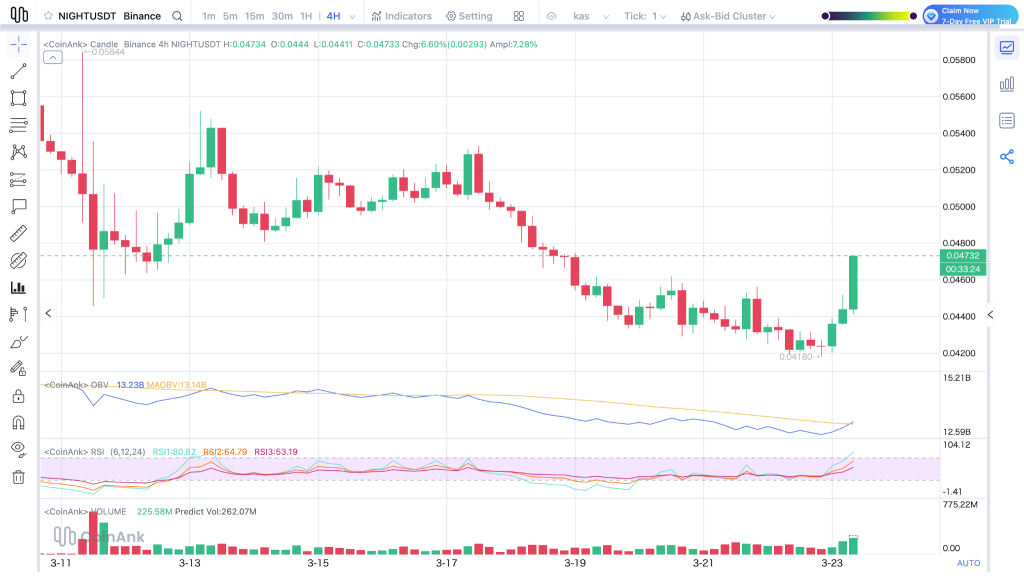
Source: CoinAnk
The RSI readings are interesting here. The fast RSI at 80.82 is screaming overbought. That’s the kind of level that usually comes with a warning label. The medium and slow RSIs are at 64.79 and 53.19, which are less extreme.
So the short-term momentum is hot, but the longer-term momentum is still catching up. That can sometimes mean a pullback is coming, or it can mean the rally is just getting started. Hard to tell.
Here’s Why DeXe (DEXE) Price Pumped 200%_**
The Bigger Picture
It’s worth remembering that NIGHT was on the weekly losers list recently, down 16.6% last week. So this pump is really just recovering some of those losses. The privacy tech narrative is still there, and the Cardano integration is still on the horizon. The mainnet launch is supposed to be coming soon, which could be a real catalyst if it actually delivers.
But for now, this move looks like a technical bounce. The NIGHT price hit a level where buyers decided to step in, and the momentum carried it higher. The real test is coming up at $0.048 to $0.050. If it can break through that, the structure changes. If it gets rejected, we could be looking at a retest of $0.044.
What Comes Next for NIGHT
The NIGHT price is moving on decent volume, and the chart is showing some strength after weeks of bleeding. The fast RSI is overheated, but if it can hold above $0.044 and build momentum toward $0.048, that would be a sign that this bounce has more room to run.
River (RIVER) Price Keeps Pumping as TD Indicator Signals Another Rally_**
On the downside, $0.042 is the level to watch. A break below that, and the downtrend probably resumes. For now, Midnight is having a moment. Whether it lasts depends on whether the volume sticks around.
Disclaimer: The information on this page may come from third parties and does not represent the views or opinions of Gate. The content displayed on this page is for reference only and does not constitute any financial, investment, or legal advice. Gate does not guarantee the accuracy or completeness of the information and shall not be liable for any losses arising from the use of this information. Virtual asset investments carry high risks and are subject to significant price volatility. You may lose all of your invested principal. Please fully understand the relevant risks and make prudent decisions based on your own financial situation and risk tolerance. For details, please refer to
Disclaimer.
Related Articles
PEPE Reclaims 0.00000400 — Is This 1.8% Move the Start of a Bigger Run?
PEPE rebounds from 0.00000385 support, forming higher lows and stronger bullish structure.
Technical indicators like MACD and RSI show momentum with room for further upside.
Key resistance at 0.00000410; support at 0.00000380 critical for trend continuation.
PepeCoin — PEPE, has
CryptoNewsLand4h ago
ETH drops 0.58% in 15 minutes: derivatives liquidity contraction and proactive position reduction dominate short-term pullback
From 2026-04-19 04:30 to 2026-04-19 04:45 (UTC), within ETH’s 15-minute candlestick chart, the return recorded -0.58%, and the price range was 2321.62 to 2342.04 USDT, with an amplitude of 0.87%. The short-term selloff occurred against a backdrop of increased overall market volatility and a broad decline in the prices of major crypto assets; overall market risk appetite clearly fell, and traders’ wait-and-see sentiment strengthened.
The main driver behind this abnormal move is a sharp contraction in liquidity in the derivatives market and leveraged funds proactively reducing positions. Data shows that over the past 24 hours, the ETH/USD perpetual contract trading volume dropped 67.16% to approximately 74.87 million, open interest edged down 3.33% to 329 million, and liquidation amounts did not expand unusually. This structure indicates that the market lacks the risk of passive cascades; more funds chose to proactively step aside and wait on the sidelines, intensifying short-term selling pressure.
In addition, the long/short structure in which shorts held the upper hand (long/short ratio 47.48%:52.52%) and sentiment synchronization with the panic range reinforced the downward price trend. During the same period, major coins such as BTC and SOL also fell 2%-3.4% in tandem, further showing that this pullback was driven by system-wide risk sentiment. On-chain funds did not show any large abnormal transfers or large-scale liquidations of DeFi protocols; spot and on-chain liquidity remained generally stable, and no sudden system risk resonance was observed.
Current volatility-related risks still need close monitoring, especially as overall risk appetite continues to contract—ETH’s short-term price may face further downside probing. Watch subsequent changes in derivatives trading volume and open interest, extreme shifts in the long/short ratio and funding rate, and promptly monitor on-chain fund flows, large transfers, and any signs of amplified platform net outflows. For more market anomalies and deeper analysis, please continue to follow our upcoming market updates.
GateNews5h ago
Spark Protocol's January delisting of rsETH proves prudent as Aave faces ETH liquidity crisis
Spark Protocol's strategy of delisting low-usage assets and tightening collateral has faced initial backlash but proved wise during market turmoil. While maintaining higher interest rate caps, SparkLend ensures liquidity, unlike Aave, which now faces significant risks.
GateNews5h ago
Request Network (REQ) Surges 23.68% in 15 Minutes, 24-Hour Gain Reaches 116.52%
Request Network (REQ) surged 23.68% in just 15 minutes, reaching $0.152, with a 24-hour rise of 116.52% and trading volume over $8 million. Factors include retail interest and whale accumulation. Resistance at $0.160 and support at $0.122 are under observation.
GateNews6h ago
Solana Price Stalls Near $80 as ETF Outflows Weigh
Solana trades around $80, facing bearish sentiment due to ETF outflows and declining retail participation. Technical indicators show mixed signals, with resistance at $87 and $98, while support at $77 remains critical for stability.
CryptoFrontNews11h ago
Dogecoin Holds $0.094 as X Cashtags Drive Market Attention
Key Insights
Dogecoin holds above $0.094 despite market weakness as Bitcoin and Ethereum stabilize, reflecting resilience and sustained demand across major cryptocurrencies during the consolidation phase.
X launches smart cashtags enabling real-time crypto and stock tracking, improving marke
CryptoNewsLand14h ago
