Trade
Basic
Futures
Futures
Hundreds of contracts settled in USDT or BTC
TradFi
Gold
Trade global traditional assets with USDT in one place
Options
Hot
Trade European-style vanilla options
Unified Account
Maximize your capital efficiency
Demo Trading
Futures Kickoff
Get prepared for your futures trading
Futures Events
Participate in events to win generous rewards
Demo Trading
Use virtual funds to experience risk-free trading
Earn
Launch
CandyDrop
Collect candies to earn airdrops
Launchpool
Quick staking, earn potential new tokens
HODLer Airdrop
Hold GT and get massive airdrops for free
Launchpad
Be early to the next big token project
Alpha Points
Trade on-chain assets and enjoy airdrop rewards!
Futures Points
Earn futures points and claim airdrop rewards
Investment
Simple Earn
Earn interests with idle tokens
Auto-Invest
Auto-invest on a regular basis
Dual Investment
Buy low and sell high to take profits from price fluctuations
Soft Staking
Earn rewards with flexible staking
Crypto Loan
0 Fees
Pledge one crypto to borrow another
Lending Center
One-stop lending hub
VIP Wealth Hub
Customized wealth management empowers your assets growth
Private Wealth Management
Customized asset management to grow your digital assets
Quant Fund
Top asset management team helps you profit without hassle
Staking
Stake cryptos to earn in PoS products
Smart Leverage
New
No forced liquidation before maturity, worry-free leveraged gains
GUSD Minting
Use USDT/USDC to mint GUSD for treasury-level yields
More
# CryptoCharts
5.07K
CanDx
$PEOPLE
Sharp vertical move, dip entry safer.
Entry: 0.01010 – 0.01022
TP1: 0.01048
TP2: 0.01072
TP3: 0.01098
SL: Below 0.00995
#PEOPLE #AltcoinSeason #CryptoCharts
Sharp vertical move, dip entry safer.
Entry: 0.01010 – 0.01022
TP1: 0.01048
TP2: 0.01072
TP3: 0.01098
SL: Below 0.00995
#PEOPLE #AltcoinSeason #CryptoCharts
PEOPLE5,86%
- Reward
- 1
- Comment
- Repost
- Share
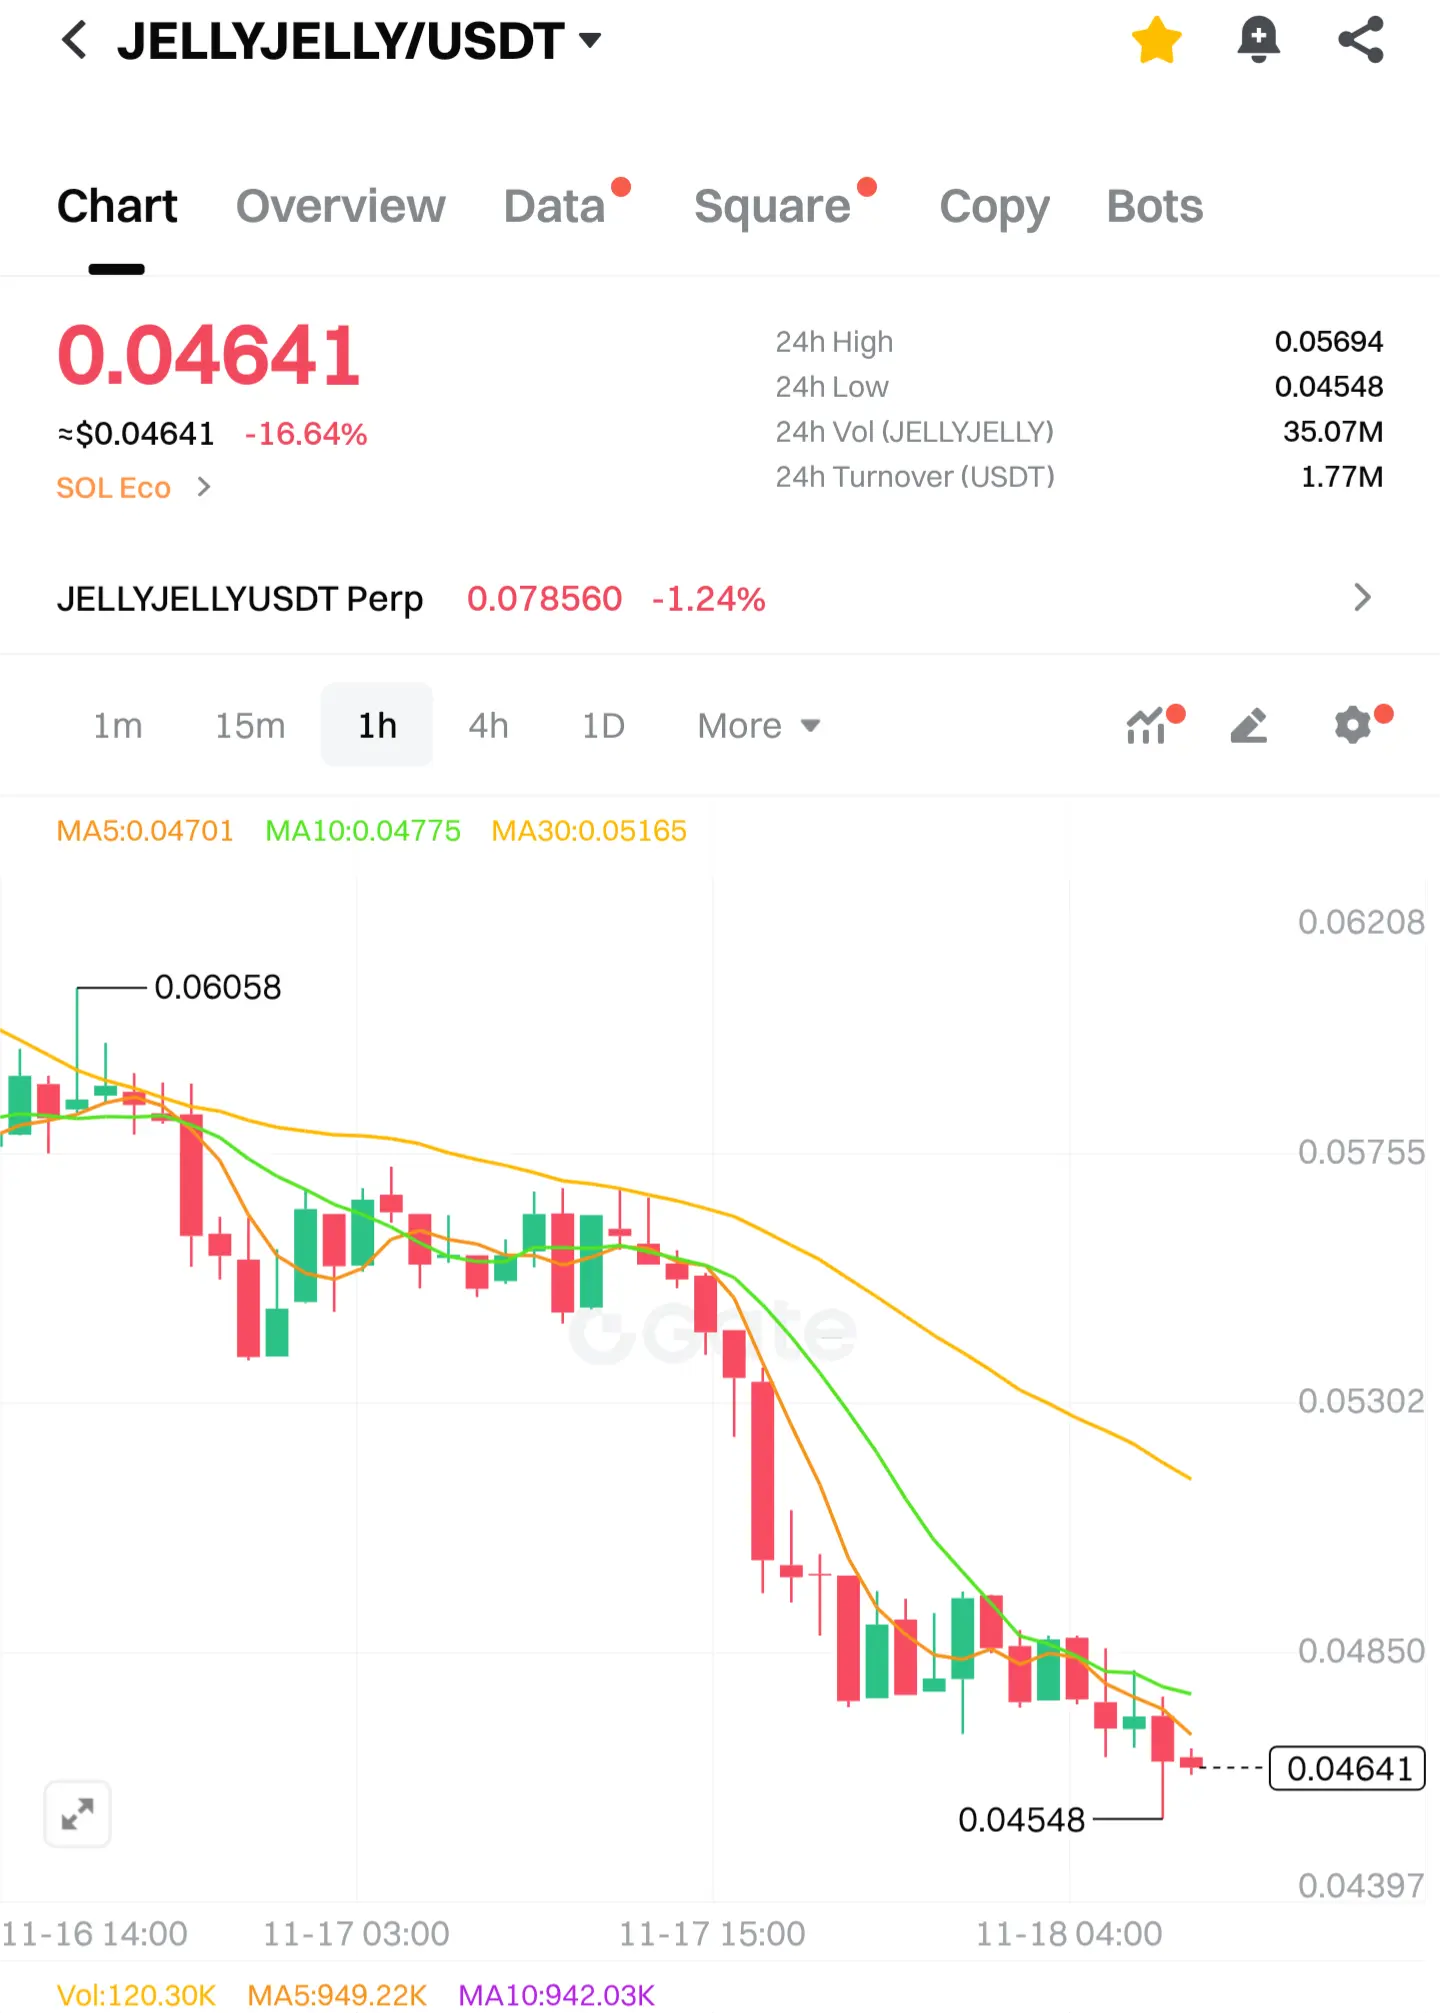
🔥 $JELLYJELLY Breaking Down Hard! 🔥
$JELLYJELLY is sliding fast, now sitting near 0.04641, down over 16% in the last 24 hours. The chart shows a clean downtrend, with every bounce getting weaker and price hugging the lows. 📉
It just tapped 0.04548, its fresh 24h low — a sign sellers are still in full control. The moving averages are all pointing downward, showing momentum is still fading.
This is one of those moments where the market feels heavy, quiet… and dangerous. Stay alert — sharp drops like these often precede either a brutal flush or a sudden snap-back surprise.
#JELLYJELLY #Mar
JELLYJELLY2,18%
- Reward
- 1
- 2
- Repost
- Share
ZAYDEN_ETH:
niceView More
I share what I see — strong opinions, always weakly held. I'm right as often as I'm wrong. If my charts offend you, that's on you.
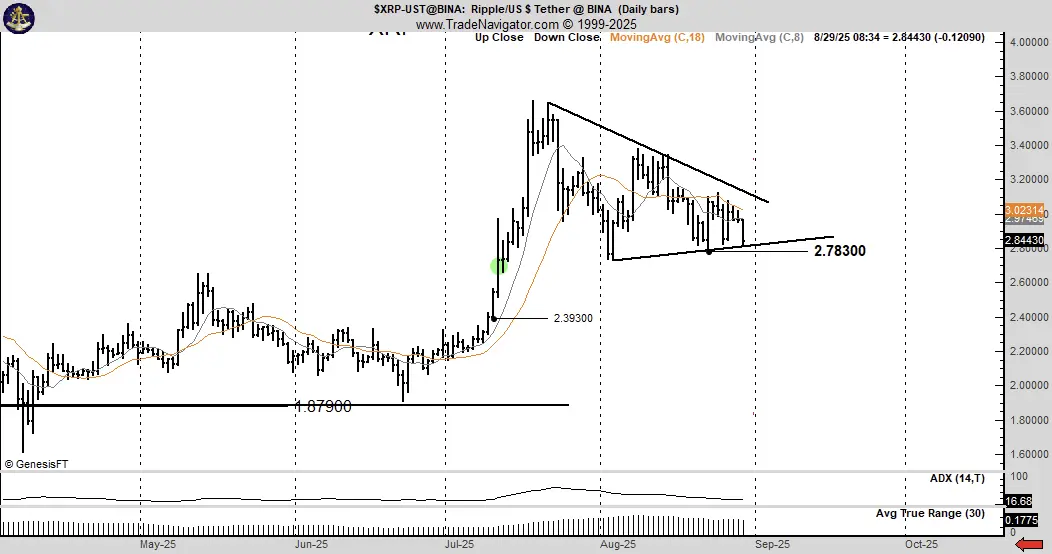
XRP's chart is flashing some serious warning signs. ⚠️📉
#XRP #CryptoCharts #MarketAnalysis #CryptoWarning #DYOR #NotFinancialAdvice#
XRP's chart is flashing some serious warning signs. ⚠️📉
#XRP #CryptoCharts #MarketAnalysis #CryptoWarning #DYOR #NotFinancialAdvice#
- Reward
- like
- Comment
- Repost
- Share
Load More
Join 40M users in our growing community
⚡️ Join 40M users in the crypto craze discussion
💬 Engage with your favorite top creators
👍 See what interests you
Trending Topics
79.39K Popularity
5.87K Popularity
5.57K Popularity
51.92K Popularity
3.09K Popularity
259.67K Popularity
243.38K Popularity
14.9K Popularity
2.71K Popularity
2.15K Popularity
1.76K Popularity
2.35K Popularity
2.63K Popularity
31.46K Popularity
News
View MoreThe probability that the Federal Reserve will keep interest rates unchanged in March is currently reported at 90.8%.
6 m
In the past 24 hours, the entire network's contract liquidations reached $144 million, mainly from short positions.
17 m
Roundhill has submitted multiple "prediction market event contract" election ETF applications
22 m
Polymarket launches a new 5-minute cryptocurrency price fluctuation trading market, powered by Chainlink
1 h
Bitcoin OG Garrett Jin Sells 5,000 BTC Worth $348.82M, Withdraws $53.12M USDT
1 h
Pin