#CryptoMarketStructureUpdate
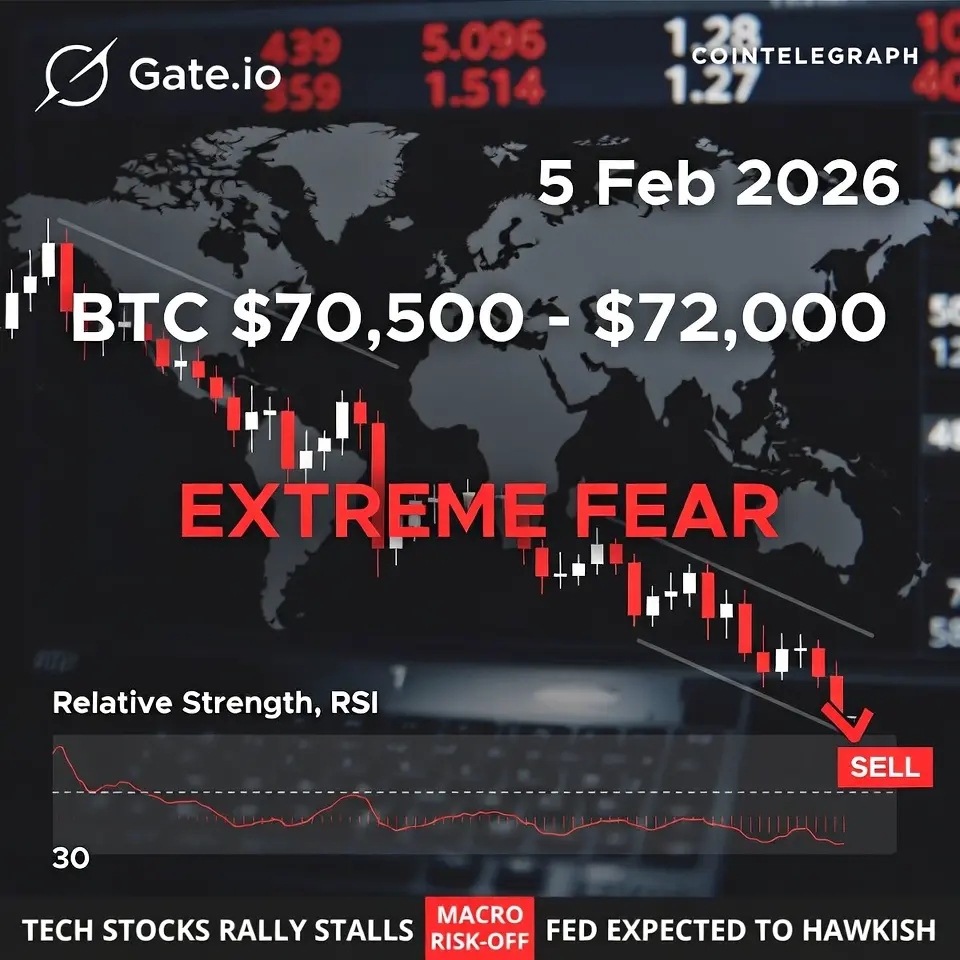
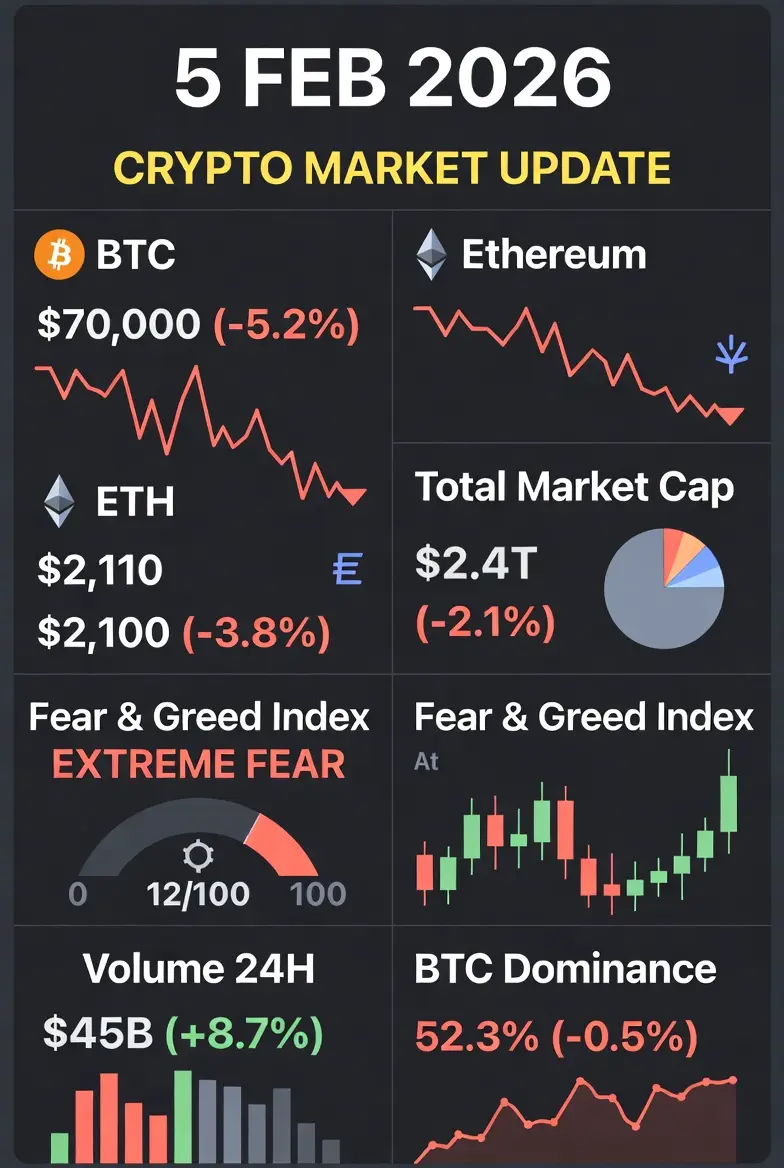
The cryptocurrency market is deep in a severe bearish correction and capitulation phase. Extreme fear dominates (Fear & Greed Index sitting in the 11–23 range, firmly in "Extreme Fear"). Total market cap has plunged to approximately $2.35–$2.45 trillion (down 4–5%+ in the last 24 hours, with roughly $450–500 billion wiped out since late January peaks). This move is driven by macro risk-off sentiment: spillover from the AI/tech stock rout, hawkish Fed expectations (no rapid rate cuts anticipated), ongoing geopolitical tensions, selective ETF outflows, heavy long liquidations (recent single-day figures around $500M–$650M, cumulative billions), and noticeably weak on-chain demand. Bitcoin dominance remains elevated (around 55–59%), but the entire market is bleeding — altcoins are suffering even more severely.
1. Overall Market Structure & Trend
Total Crypto Market Cap: ~$2.35T–$2.45T (sharp decline; multiple reports highlight over $467 billion erased in roughly one week).
Dominance & Rotation: Bitcoin is holding relatively better (dominance rising), while altcoins face deeper pain — classic risk-off behavior where speculative assets bleed heavily and utility-focused sectors show slight relative resilience.
Trend & Patterns: Broad downtrend characterized by lower highs and lower lows since late 2025 / early 2026 peaks. Descending channel clearly visible on daily and weekly charts. Volatility spiked during the liquidation cascade and is now turning choppy near key support zones. RSI readings are oversold across most assets (average ~30–40, dipping below 30 in several spots), suggesting a potential short-term relief bounce — but no convincing reversal signal has appeared yet. Momentum remains firmly bearish; analysts are debating whether this is a mid-cycle correction or the early stages of a broader bear market (some forecasting a bottom around Q3 2026).
Sentiment: Extreme Fear levels — retail panic selling and forced liquidations are widespread, though historically such readings frequently mark local bottoms. Institutions appear to be quietly accumulating dips in fundamentally strong projects.
2. Bitcoin (BTC) – Market Leader Breakdown
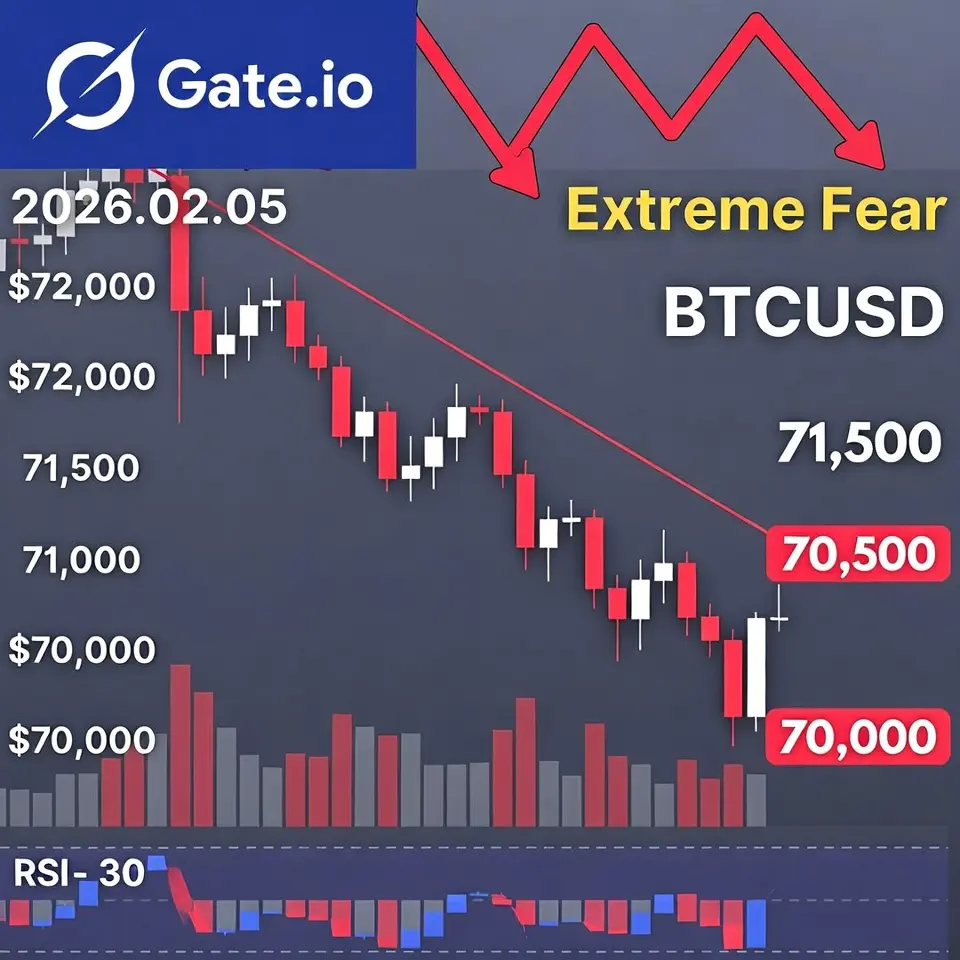
Current Price: ~$70,500–$72,000 range (down 5–7.5%+ over the last 24 hours; Asian session lows touched near $70,100–$70,700, with brief dips below $71,000; live quotes showing ~$70,900–$71,350 in recent prints).
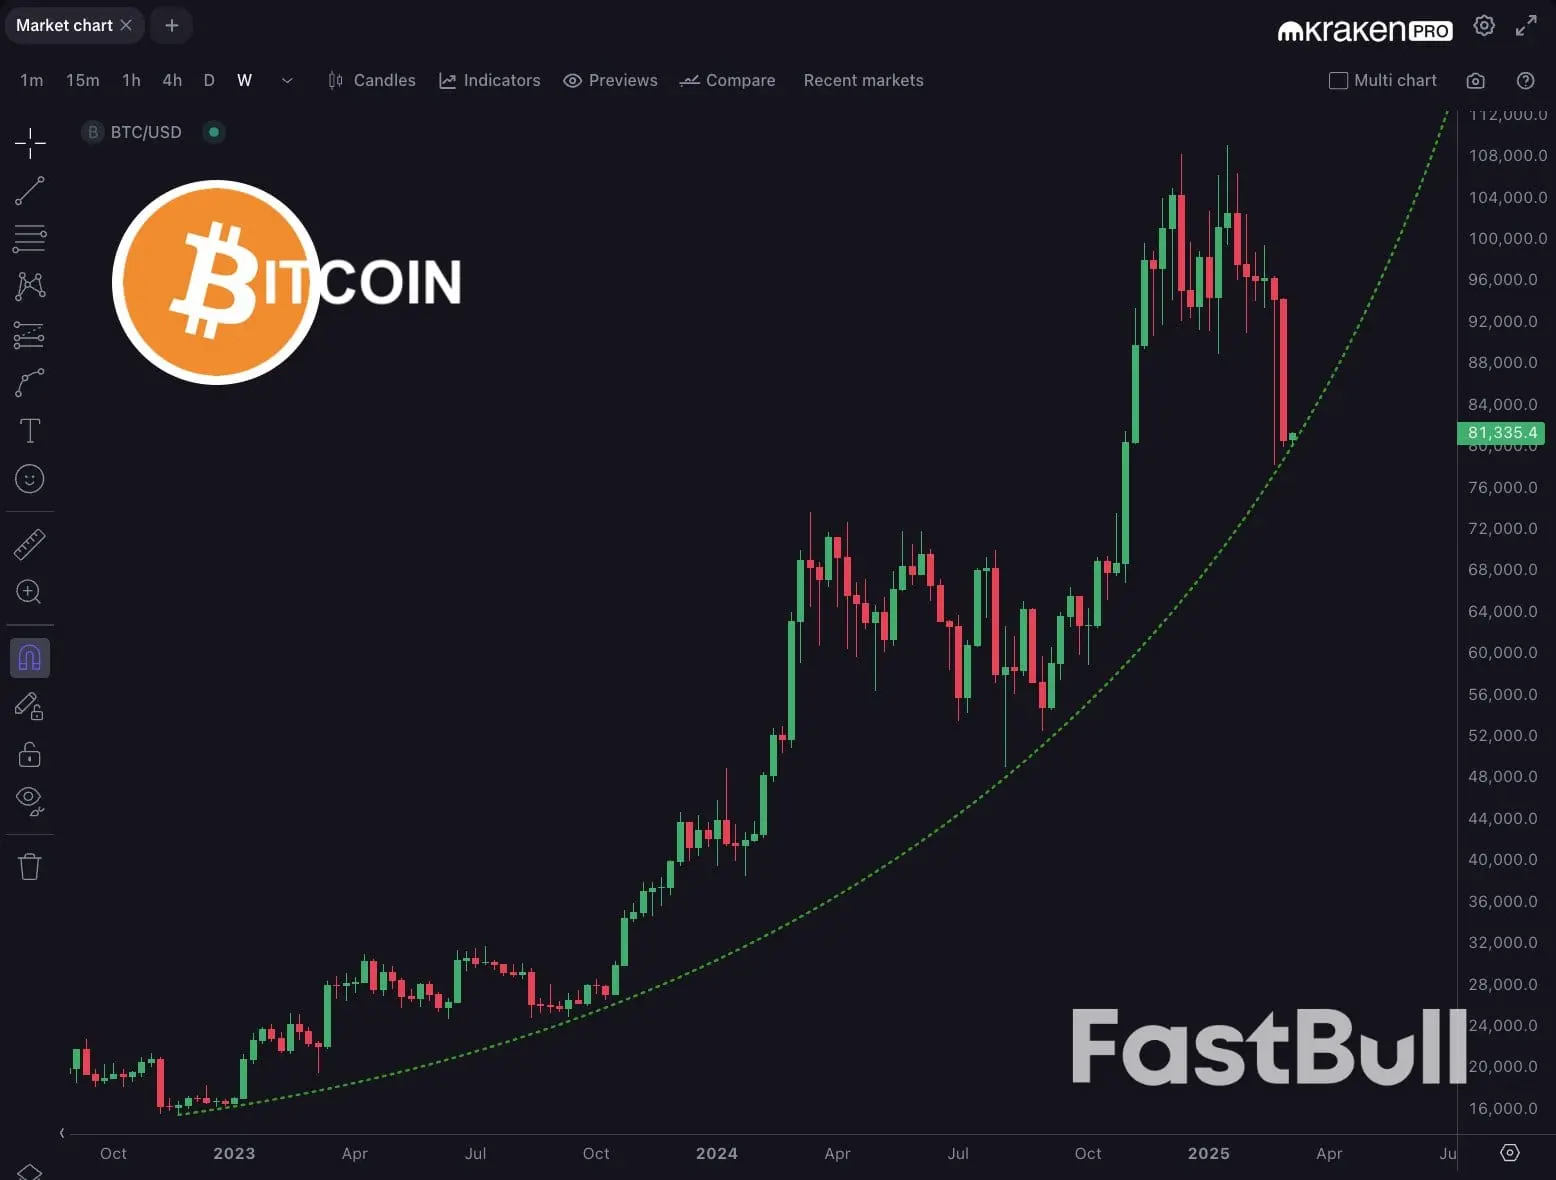
Trend: Brutal correction underway — down more than 40% from the 2025 peak (~$126k), approximately 18–20% wiped out year-to-date in 2026, fully erasing post-election gains. Consecutive red candles continue, now testing significant cycle lows.
Technical Structure:
Support: Psychological $70,000 level is critical (holding here keeps bounce potential alive; a clean break opens the door to the $68,000–$65,000 zone, with the 200-week EMA sitting near $68,400 as the next major structural level). In a worst-case macro deterioration, extension toward $60,000–$58,000 cannot be ruled out.
Resistance: $73,000–$75,000 (former support now acting as resistance), followed by $76,000–$78,000 (prior consolidation areas).
Patterns: Downtrend channel remains intact with heavy downside volume. RSI is oversold, and on-chain data shows a high percentage of supply now underwater, increasing stress among holders.
Outlook: Short-term bearish pressure is dominant — the $70,000 level is the immediate make-or-break zone. Macro factors (tech rout, Fed policy) continue to override crypto-specific drivers.
3. Ethereum (ETH) & Altcoins
ETH Price: ~$2,090–$2,150 (down 7–8%+ in recent sessions; lows near $2,078–$2,100, with weekly declines in the 25–28% range).
Trend: Underperforming Bitcoin significantly (higher beta in risk-off environments) — on-chain activity is slowing, gas fees remain low, and downside pressure is more intense.
Technical: Key supports broken; structure shows lower highs and lower lows with oversold conditions, but recovery requires Bitcoin to stabilize first.
Altcoins: Most of the top 100 are deep red (examples: SOL around $90–$91 down over 26% weekly; many others in the -20–30% range). Utility-focused sectors (RWA projects like Chainlink and ONDO, infrastructure plays, stablecoin-related assets) are showing relative strength and less severe bleeding — clear decoupling: speculative altcoins are being crushed while real-use-case projects demonstrate more resilience. Layer-1 chains (SOL, ADA, AVAX) remain heavily in the red.
4. Short-Term vs Long-Term Outlook & Trader Plans
Short-Term (Next Days–Weeks – Feb/March 2026): Bearish bias remains strong — further downside risk exists if Bitcoin breaks $70,000 cleanly (potential extension targets $65,000–$60,000). Expect choppy ranges near support levels with elevated volatility. Extreme fear readings have historically preceded local bottoms, but confirmation is essential (volume spike, higher lows, clear reversal candles). Fakeouts are frequent — avoid FOMO entries.
Long-Term (Rest of 2026 and Beyond): Structurally bullish outlook persists for patient participants. Institutional adoption continues to build (ETF products maturing), US regulatory clarity is progressing (Senate bill advancements), real-world asset tokenization is accelerating, stablecoin usage is expanding, and DeAI narratives are gaining traction. The market cycle appears to be evolving — more adoption-driven than strictly tied to halving timelines. Many view the current drawdown as a healthy reset and accumulation opportunity after the 2025 highs; longer-term forecasts still point toward recovery and potential new all-time highs later in the year (some targets $138,000–$200,000+ for BTC end-of-year if macro conditions stabilize).
Trader Hazrat – Practical Next Plans (Realistic Discussion)
The market is currently in a high-risk, low-conviction environment — survival and capital preservation take priority over aggressive prediction. Discipline is everything.
Short-Term Traders (Scalp/Swing):
Avoid aggressive long entries — fake bounces are common and punishing.
Wait for Bitcoin to hold $70,000 decisively with strong reversal evidence (volume increase, higher low formation) → possible bounce target toward $73,000–$75,000.
Bearish setups: If $70,000 breaks cleanly, consider shorts targeting $68,000–$65,000 (keep stops tight above recent swing highs).
Core rules: Reduce position size to 50% of normal, use wider stops, place limit orders only at precise levels. Holding cash or stablecoins is the safest stance if conviction is low. Range trading in chop is viable but requires precision.
Medium-Term (1–3 Months – Position Building):
View this dip as a legitimate accumulation window — dollar-cost average into Bitcoin and Ethereum on weakness below $70,000 and $2,000 respectively.
Prioritize utility and resilient altcoins (RWA, infrastructure plays) that have bled less. Avoid pure speculative/memecoin exposure at this stage.
Consider hedging with stablecoins if macro fears intensify further.
Long-Term Holders / Allocate:
The bigger-picture setup remains bullish — continue allocating gradually on dips rather than going all-in at once.
Primary risks: Extended hawkish Fed policy or major geopolitical escalation could push prices deeper.
Primary opportunities: Extreme fear environments have historically been strong buying zones for fundamentally sound assets.
Bottom Line
Bitcoin is testing $70,000 as the immediate make-or-break level — holding opens the door to a relief rally toward $75,000+, while a clean break signals more pain ahead (potentially $65,000–$60,000 zone). Ethereum sits around $2,100 and is bleeding harder, with total market cap near $2.4 trillion after massive recent losses. Macro risk-off and liquidation cascades are in control right now.
The cryptocurrency market is deep in a severe bearish correction and capitulation phase. Extreme fear dominates (Fear & Greed Index sitting in the 11–23 range, firmly in "Extreme Fear"). Total market cap has plunged to approximately $2.35–$2.45 trillion (down 4–5%+ in the last 24 hours, with roughly $450–500 billion wiped out since late January peaks). This move is driven by macro risk-off sentiment: spillover from the AI/tech stock rout, hawkish Fed expectations (no rapid rate cuts anticipated), ongoing geopolitical tensions, selective ETF outflows, heavy long liquidations (recent single-day figures around $500M–$650M, cumulative billions), and noticeably weak on-chain demand. Bitcoin dominance remains elevated (around 55–59%), but the entire market is bleeding — altcoins are suffering even more severely.
1. Overall Market Structure & Trend
Total Crypto Market Cap: ~$2.35T–$2.45T (sharp decline; multiple reports highlight over $467 billion erased in roughly one week).
Dominance & Rotation: Bitcoin is holding relatively better (dominance rising), while altcoins face deeper pain — classic risk-off behavior where speculative assets bleed heavily and utility-focused sectors show slight relative resilience.
Trend & Patterns: Broad downtrend characterized by lower highs and lower lows since late 2025 / early 2026 peaks. Descending channel clearly visible on daily and weekly charts. Volatility spiked during the liquidation cascade and is now turning choppy near key support zones. RSI readings are oversold across most assets (average ~30–40, dipping below 30 in several spots), suggesting a potential short-term relief bounce — but no convincing reversal signal has appeared yet. Momentum remains firmly bearish; analysts are debating whether this is a mid-cycle correction or the early stages of a broader bear market (some forecasting a bottom around Q3 2026).
Sentiment: Extreme Fear levels — retail panic selling and forced liquidations are widespread, though historically such readings frequently mark local bottoms. Institutions appear to be quietly accumulating dips in fundamentally strong projects.
2. Bitcoin (BTC) – Market Leader Breakdown
Current Price: ~$70,500–$72,000 range (down 5–7.5%+ over the last 24 hours; Asian session lows touched near $70,100–$70,700, with brief dips below $71,000; live quotes showing ~$70,900–$71,350 in recent prints).
Trend: Brutal correction underway — down more than 40% from the 2025 peak (~$126k), approximately 18–20% wiped out year-to-date in 2026, fully erasing post-election gains. Consecutive red candles continue, now testing significant cycle lows.
Technical Structure:
Support: Psychological $70,000 level is critical (holding here keeps bounce potential alive; a clean break opens the door to the $68,000–$65,000 zone, with the 200-week EMA sitting near $68,400 as the next major structural level). In a worst-case macro deterioration, extension toward $60,000–$58,000 cannot be ruled out.
Resistance: $73,000–$75,000 (former support now acting as resistance), followed by $76,000–$78,000 (prior consolidation areas).
Patterns: Downtrend channel remains intact with heavy downside volume. RSI is oversold, and on-chain data shows a high percentage of supply now underwater, increasing stress among holders.
Outlook: Short-term bearish pressure is dominant — the $70,000 level is the immediate make-or-break zone. Macro factors (tech rout, Fed policy) continue to override crypto-specific drivers.
3. Ethereum (ETH) & Altcoins
ETH Price: ~$2,090–$2,150 (down 7–8%+ in recent sessions; lows near $2,078–$2,100, with weekly declines in the 25–28% range).
Trend: Underperforming Bitcoin significantly (higher beta in risk-off environments) — on-chain activity is slowing, gas fees remain low, and downside pressure is more intense.
Technical: Key supports broken; structure shows lower highs and lower lows with oversold conditions, but recovery requires Bitcoin to stabilize first.
Altcoins: Most of the top 100 are deep red (examples: SOL around $90–$91 down over 26% weekly; many others in the -20–30% range). Utility-focused sectors (RWA projects like Chainlink and ONDO, infrastructure plays, stablecoin-related assets) are showing relative strength and less severe bleeding — clear decoupling: speculative altcoins are being crushed while real-use-case projects demonstrate more resilience. Layer-1 chains (SOL, ADA, AVAX) remain heavily in the red.
4. Short-Term vs Long-Term Outlook & Trader Plans
Short-Term (Next Days–Weeks – Feb/March 2026): Bearish bias remains strong — further downside risk exists if Bitcoin breaks $70,000 cleanly (potential extension targets $65,000–$60,000). Expect choppy ranges near support levels with elevated volatility. Extreme fear readings have historically preceded local bottoms, but confirmation is essential (volume spike, higher lows, clear reversal candles). Fakeouts are frequent — avoid FOMO entries.
Long-Term (Rest of 2026 and Beyond): Structurally bullish outlook persists for patient participants. Institutional adoption continues to build (ETF products maturing), US regulatory clarity is progressing (Senate bill advancements), real-world asset tokenization is accelerating, stablecoin usage is expanding, and DeAI narratives are gaining traction. The market cycle appears to be evolving — more adoption-driven than strictly tied to halving timelines. Many view the current drawdown as a healthy reset and accumulation opportunity after the 2025 highs; longer-term forecasts still point toward recovery and potential new all-time highs later in the year (some targets $138,000–$200,000+ for BTC end-of-year if macro conditions stabilize).
Trader Hazrat – Practical Next Plans (Realistic Discussion)
The market is currently in a high-risk, low-conviction environment — survival and capital preservation take priority over aggressive prediction. Discipline is everything.
Short-Term Traders (Scalp/Swing):
Avoid aggressive long entries — fake bounces are common and punishing.
Wait for Bitcoin to hold $70,000 decisively with strong reversal evidence (volume increase, higher low formation) → possible bounce target toward $73,000–$75,000.
Bearish setups: If $70,000 breaks cleanly, consider shorts targeting $68,000–$65,000 (keep stops tight above recent swing highs).
Core rules: Reduce position size to 50% of normal, use wider stops, place limit orders only at precise levels. Holding cash or stablecoins is the safest stance if conviction is low. Range trading in chop is viable but requires precision.
Medium-Term (1–3 Months – Position Building):
View this dip as a legitimate accumulation window — dollar-cost average into Bitcoin and Ethereum on weakness below $70,000 and $2,000 respectively.
Prioritize utility and resilient altcoins (RWA, infrastructure plays) that have bled less. Avoid pure speculative/memecoin exposure at this stage.
Consider hedging with stablecoins if macro fears intensify further.
Long-Term Holders / Allocate:
The bigger-picture setup remains bullish — continue allocating gradually on dips rather than going all-in at once.
Primary risks: Extended hawkish Fed policy or major geopolitical escalation could push prices deeper.
Primary opportunities: Extreme fear environments have historically been strong buying zones for fundamentally sound assets.
Bottom Line
Bitcoin is testing $70,000 as the immediate make-or-break level — holding opens the door to a relief rally toward $75,000+, while a clean break signals more pain ahead (potentially $65,000–$60,000 zone). Ethereum sits around $2,100 and is bleeding harder, with total market cap near $2.4 trillion after massive recent losses. Macro risk-off and liquidation cascades are in control right now.