Trade
Basic
Futures
Futures
Hundreds of contracts settled in USDT or BTC
TradFi
Gold
Trade global traditional assets with USDT in one place
Options
Hot
Trade European-style vanilla options
Unified Account
Maximize your capital efficiency
Demo Trading
Futures Kickoff
Get prepared for your futures trading
Futures Events
Participate in events to win generous rewards
Demo Trading
Use virtual funds to experience risk-free trading
Earn
Launch
CandyDrop
Collect candies to earn airdrops
Launchpool
Quick staking, earn potential new tokens
HODLer Airdrop
Hold GT and get massive airdrops for free
Launchpad
Be early to the next big token project
Alpha Points
Trade on-chain assets and enjoy airdrop rewards!
Futures Points
Earn futures points and claim airdrop rewards
Investment
Simple Earn
Earn interests with idle tokens
Auto-Invest
Auto-invest on a regular basis
Dual Investment
Buy low and sell high to take profits from price fluctuations
Soft Staking
Earn rewards with flexible staking
Crypto Loan
0 Fees
Pledge one crypto to borrow another
Lending Center
One-stop lending hub
VIP Wealth Hub
Customized wealth management empowers your assets growth
Private Wealth Management
Customized asset management to grow your digital assets
Quant Fund
Top asset management team helps you profit without hassle
Staking
Stake cryptos to earn in PoS products
Smart Leverage
New
No forced liquidation before maturity, worry-free leveraged gains
GUSD Minting
Use USDT/USDC to mint GUSD for treasury-level yields
More
Ichimori-er
Participate in horse racing betting, complete tasks to earn horse racing tickets, and enjoy a million red envelope rain daily, sharing a prize pool of 100,000 USDT at Gate 2026 Spring Festival Celebration. https://www.gate.com/competition/year-of-horse-2026?ref_type=165&utm_cmp=7EQB9Jba&ref=VGDAUVHBUW
View Original
- Reward
- 1
- Comment
- Repost
- Share
Participate in horse racing betting, complete tasks to earn horse racing tickets, and enjoy a million red envelope rain daily, sharing a prize pool of 100,000 USDT at Gate 2026 Spring Festival Celebration. https://www.gate.com/competition/year-of-horse-2026?ref_type=165&utm_cmp=7EQB9Jba&ref=VlQRUVlf
View Original
- Reward
- like
- Comment
- Repost
- Share
Participate in horse racing betting, complete tasks to earn horse racing tickets, and enjoy a million red envelope rain daily, sharing a prize pool of 100,000 USDT at the Gate 2026 Spring Festival Celebration. https://www.gate.com/competition/year-of-horse-2026?ref_type=165&utm_cmp=7EQB9Jba&ref=XgdBVVwO
View Original
- Reward
- like
- Comment
- Repost
- Share
BTx
BotXai
Created By@GateUser-b505c455
Subscription Progress
0.00%
MC:
$0
More Tokens
Participate in horse racing betting, complete tasks to earn horse racing tickets, and enjoy a million red envelope rain daily, sharing a prize pool of 100,000 USDT at the Gate 2026 Spring Festival Celebration. https://www.gate.com/competition/year-of-horse-2026?ref_type=165&utm_cmp=7EQB9Jba&ref=VlVHBA
View Original
- Reward
- like
- Comment
- Repost
- Share
Participate in horse racing betting, complete tasks to earn horse racing tickets, and enjoy a million red envelope rain daily, sharing a prize pool of 100,000 USDT at Gate 2026 Spring Festival Celebration. https://www.gate.com/competition/year-of-horse-2026?ref_type=165&utm_cmp=7EQB9Jba&ref=VVhNVAhb
View Original
- Reward
- 1
- Comment
- Repost
- Share
Participate in horse racing betting, complete tasks to earn horse racing tickets, and enjoy a million red envelope rain daily, sharing a prize pool of 100,000 USDT at the Gate 2026 Spring Festival Celebration. https://www.gate.com/competition/year-of-horse-2026?ref_type=165&ref=VQUWVW1CBG
View Original
- Reward
- like
- Comment
- Repost
- Share
Being able to preserve your money is more impressive than being able to make money.
View Original- Reward
- like
- Comment
- Repost
- Share
- Reward
- 1
- Comment
- Repost
- Share
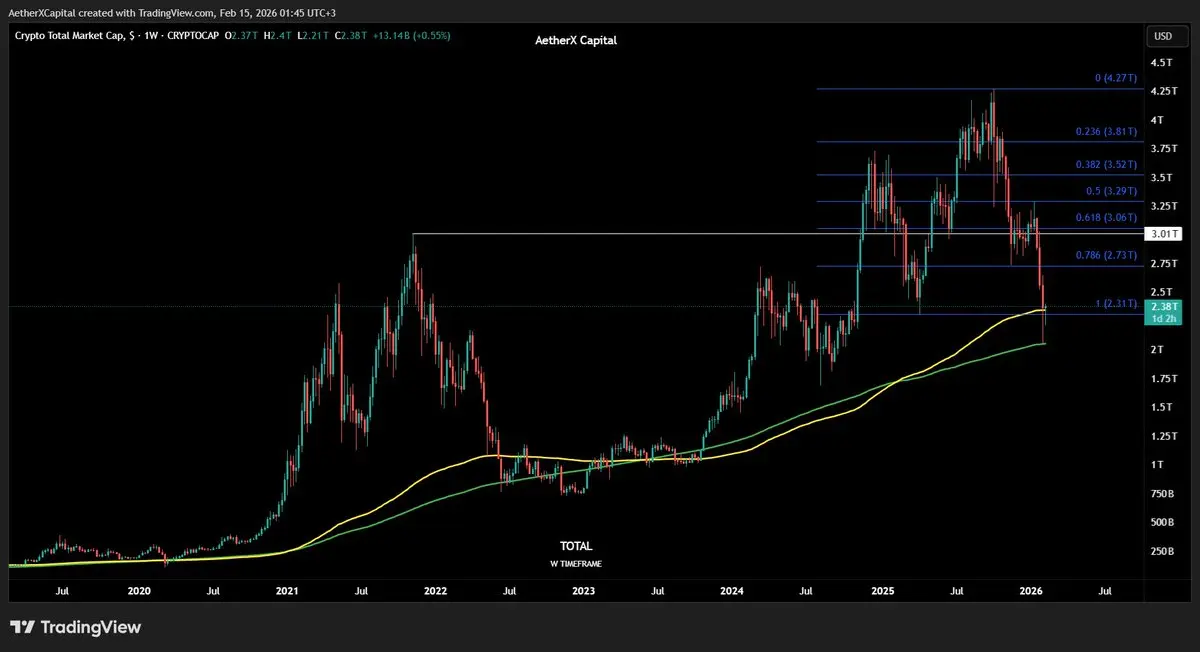
Crypto Total Market Cap has tested the 200-day EMA and 200-day MA as support on the weekly chart and has retraced its entire recent upward impulse
As long as TOTAL remains above both levels, a recovery is still likely 👀
As long as TOTAL remains above both levels, a recovery is still likely 👀
- Reward
- 1
- Comment
- Repost
- Share
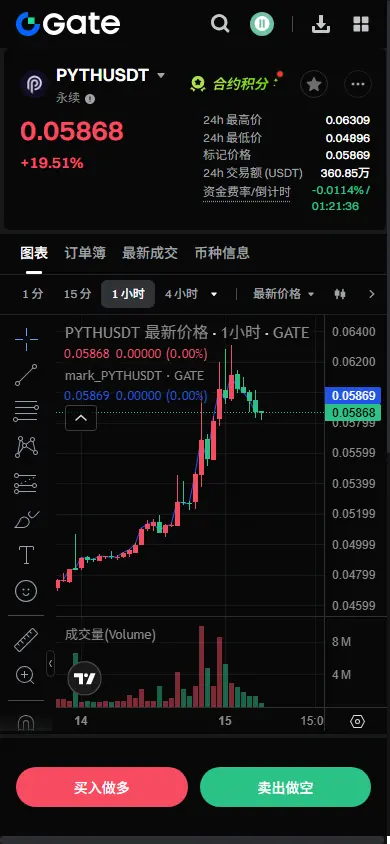
【$PYTH Signal】Pullback to add longs! 1H pullback confirmation, negative funding rate + OI steady, main force clearly defending the market
$PYTH After experiencing a 18% violent surge yesterday, the 1H level is undergoing a healthy correction. Currently, the price is near the 1H EMA20 (0.0564), receiving initial support. The 4H level has broken through the previous consolidation platform with increased volume, indicating a trend reversal to bullish. The current pullback is an excellent second entry opportunity. The negative funding rate (-0.0017%) shows that bears are still paying fees, and if
View Original$PYTH After experiencing a 18% violent surge yesterday, the 1H level is undergoing a healthy correction. Currently, the price is near the 1H EMA20 (0.0564), receiving initial support. The 4H level has broken through the previous consolidation platform with increased volume, indicating a trend reversal to bullish. The current pullback is an excellent second entry opportunity. The negative funding rate (-0.0017%) shows that bears are still paying fees, and if
- Reward
- like
- Comment
- Repost
- Share
Join the horse racing predictions, complete tasks to earn horse racing tickets, enjoy daily million Gift Coins giveaways, and share a 100,000 USDT prize pool—all at the Gate 2026 Spring Festival Celebration. https://www.gate.com/competition/year-of-horse-2026?ref_type=165&utm_cmp=7EQB9Jba&ref=A1hGBlxY
- Reward
- like
- Comment
- Repost
- Share
💰
空气
Created By@FriedChickenWithChive
Subscription Progress
0.00%
MC:
$0
More Tokens
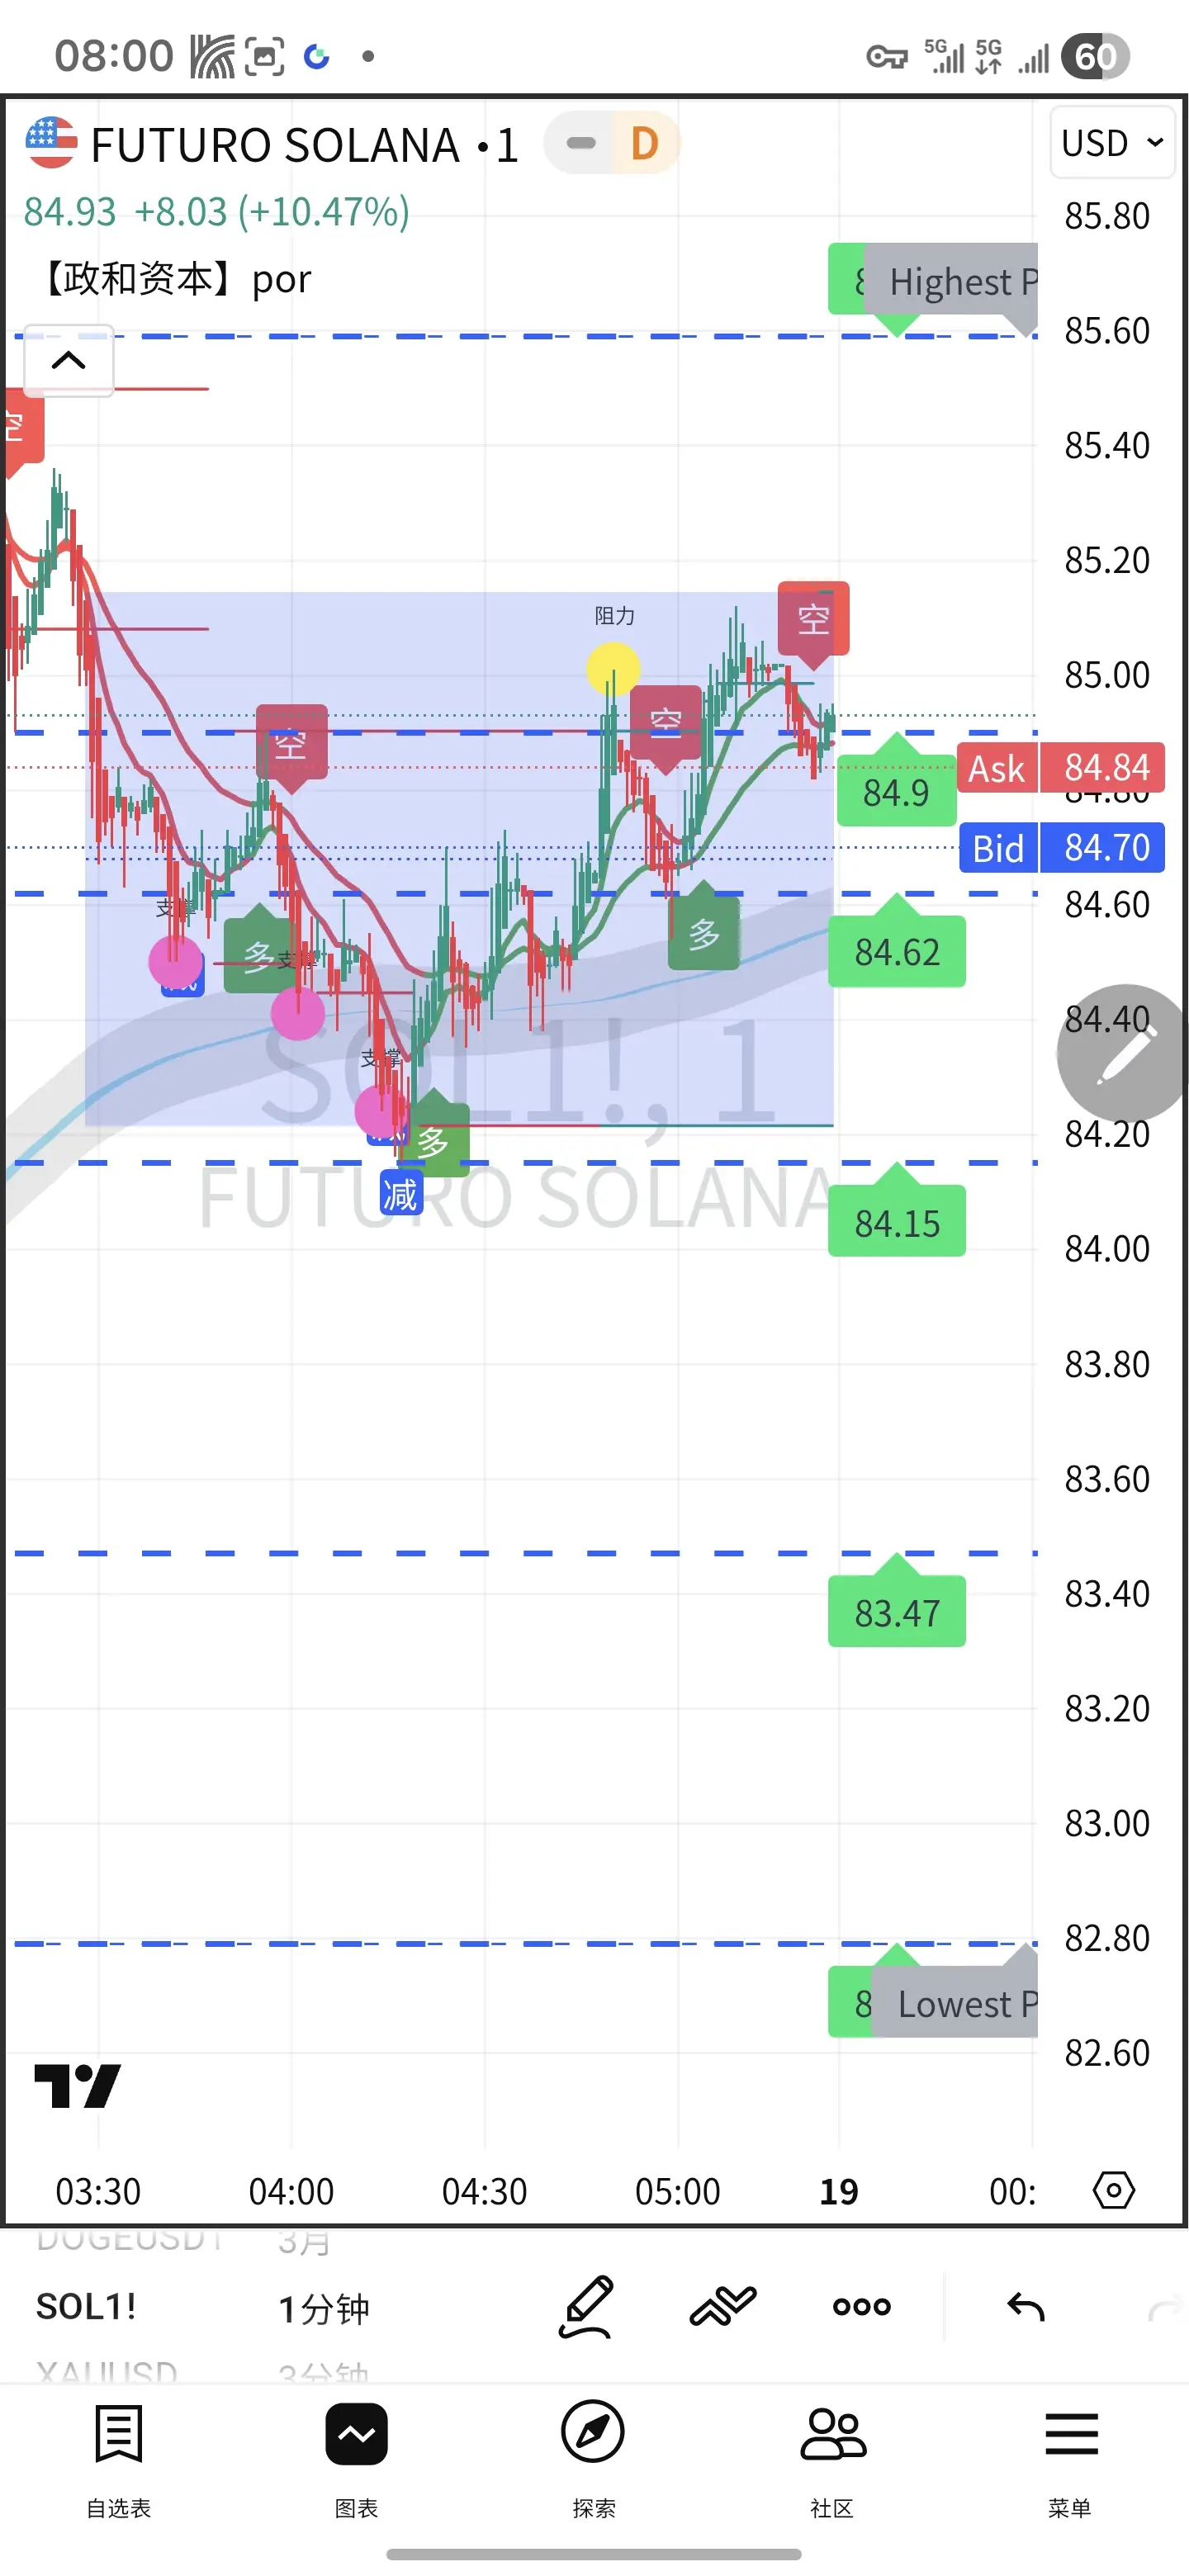
📊 2026-02-15 SOL Technical Analysis (As of 08:05)
Current Price: Approximately 80.5 USDT (Low-range oscillation, oversold rebound)
1. Short-term (1–4 hours)
- Trend: Weak rebound after oversold condition, $80 is the battle zone between bulls and bears
- Support: 79 → 77 → 74 (Strong)
- Resistance: 82 → 85 → 88 (Dense trapped zone)
- Indicators: RSI around 35, exiting oversold but still weak; MACD gold cross below zero line, rebound momentum weak
2. Daily Level
- Trend: Bearish dominance, price below all moving averages (MA5/10/20/50/200, bear alignment)
- Oversold Signal: RSI once touched 18
SOL4,21%
- Reward
- 1
- Comment
- Repost
- Share
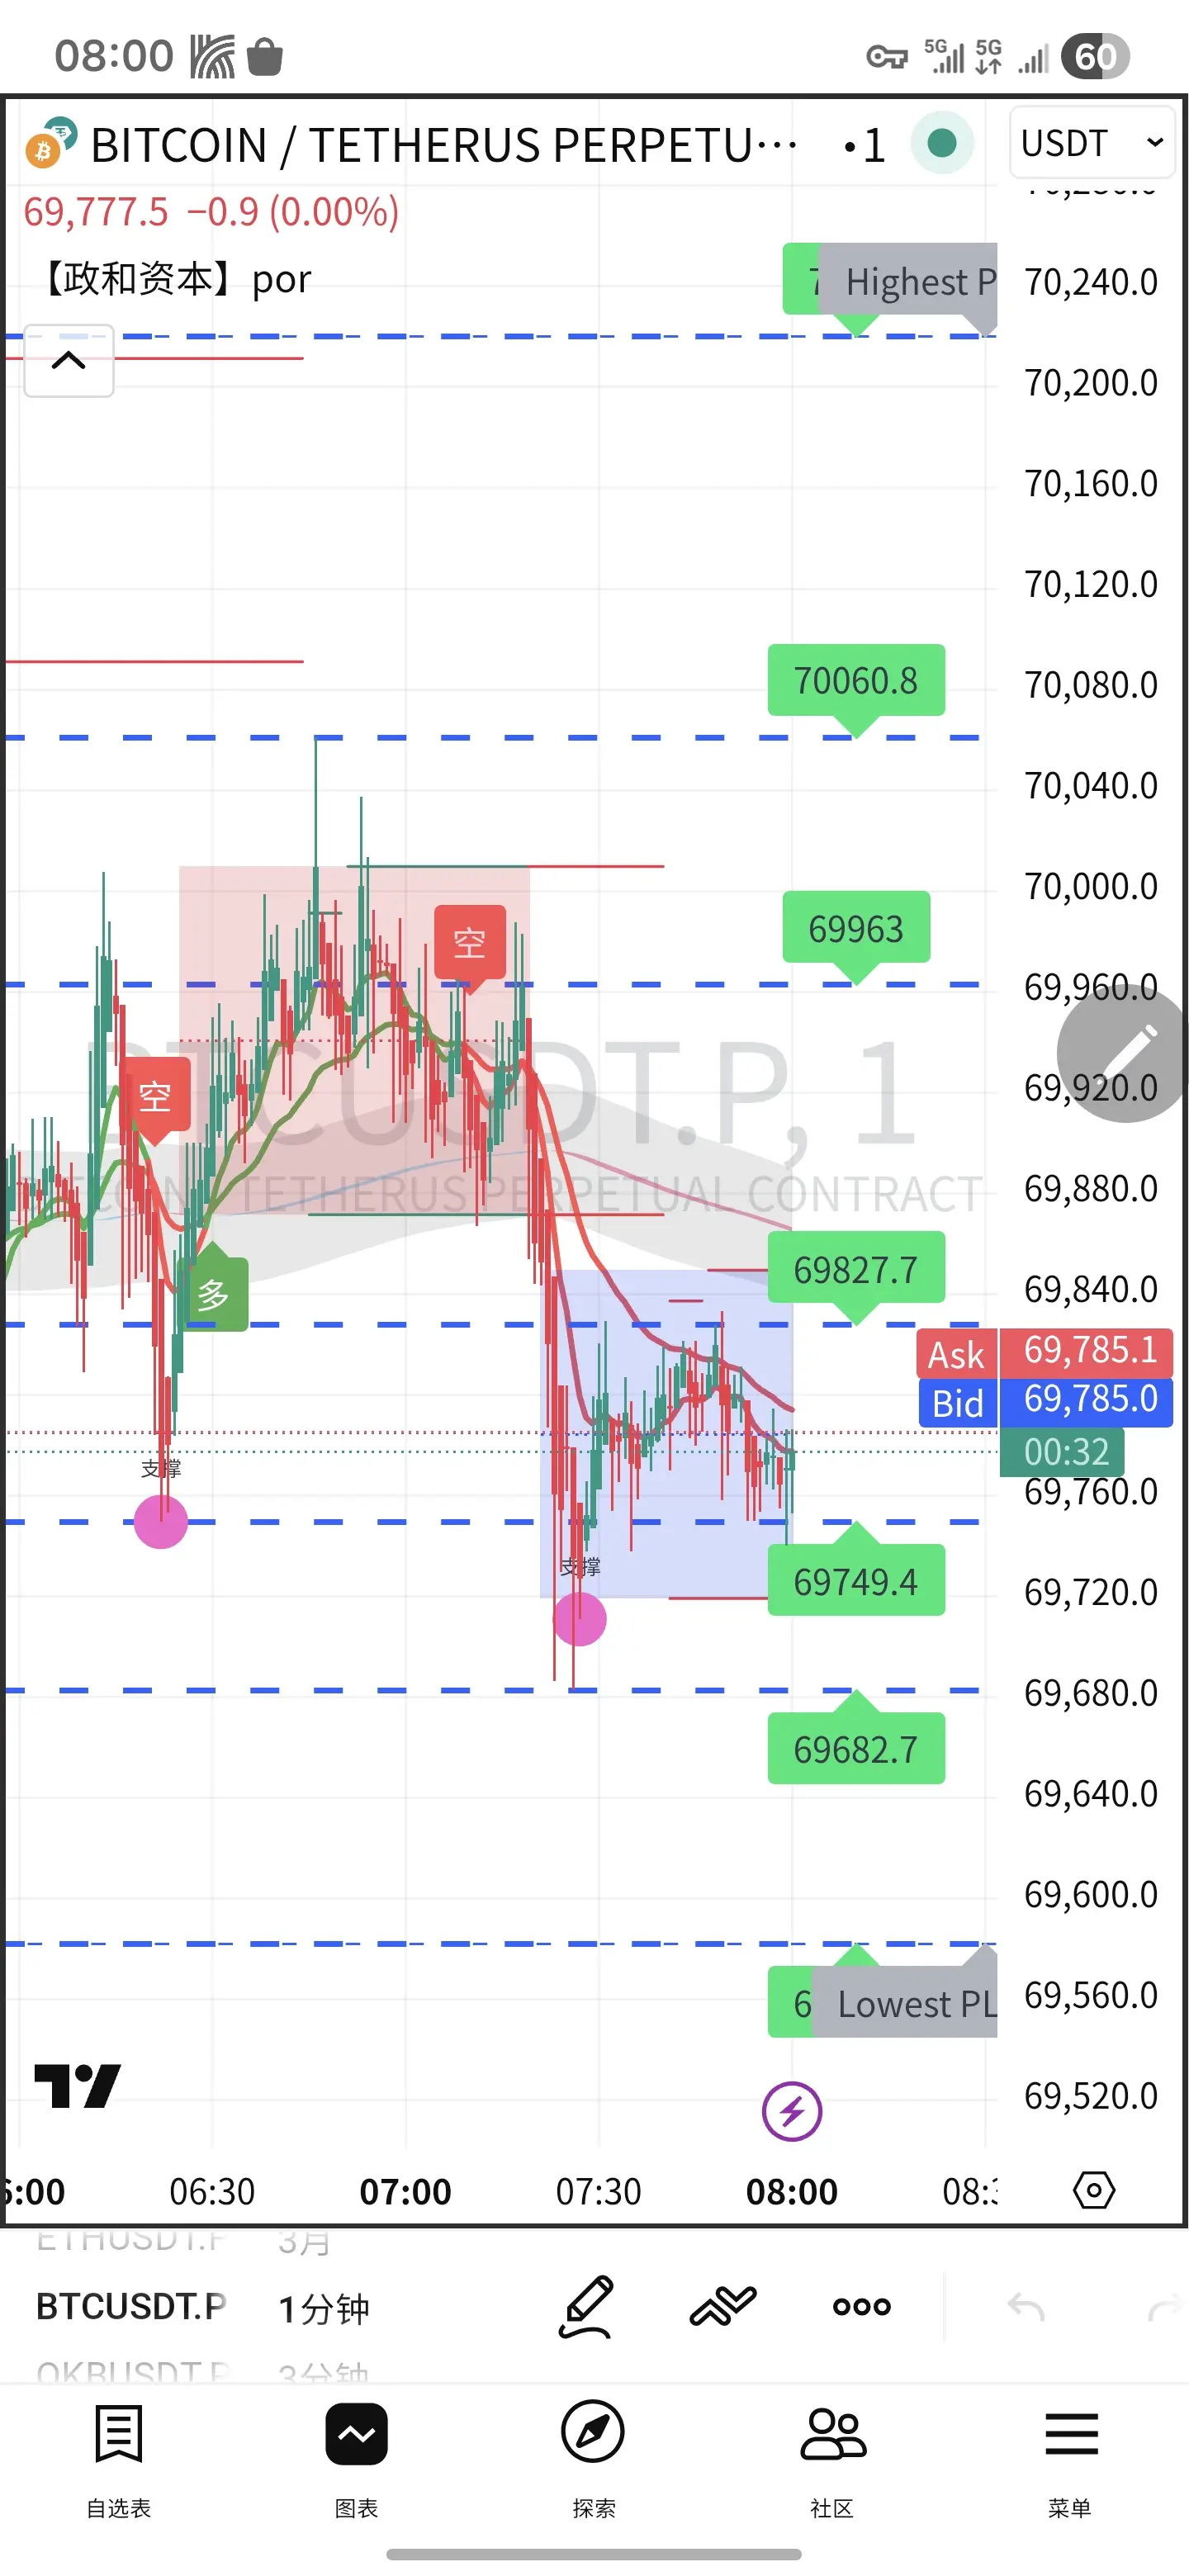
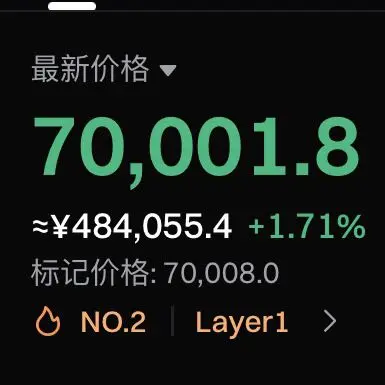
📊 2026-02-15 BTC Technical Analysis (As of 07:59)
Current Price: Approximately 69,500 USDT (Short-term rebound)
1. Short-term (1–4 hours)
- Trend: Strong rebound, supported by the upward movement of the Bollinger middle band, more bullish candles than bearish
- Support: 68,800 → 68,300 → 67,800 levels of support
- Resistance: 70,000 → 71,000 → 72,500 (Fibonacci 61.8%)
- Indicators: RSI rebounds to 45–50, exiting oversold; MACD green cross below zero line, rebound momentum strengthens
2. Daily Chart Level
- Trend: Still in a bearish structure, price below 50-day/200-day moving averages
- Overs
BTC1,07%
- Reward
- like
- Comment
- Repost
- Share
Participate in horse racing betting, complete tasks to earn horse racing tickets, and enjoy a million red envelope rain daily, sharing a prize pool of 100,000 USDT at the Gate 2026 Spring Festival Celebration. https://www.gate.com/competition/year-of-horse-2026?ref_type=165&utm_cmp=7EQB9Jba&ref=UwURVVEN
View Original
- Reward
- like
- Comment
- Repost
- Share
Participate in horse racing betting, complete tasks to earn horse racing tickets, and enjoy a million red envelope rain daily, sharing a prize pool of 100,000 USDT at Gate 2026 Spring Festival Celebration. https://www.gate.com/competition/year-of-horse-2026?ref_type=165&utm_cmp=7EQB9Jba&ref=VlQRUVlf
View Original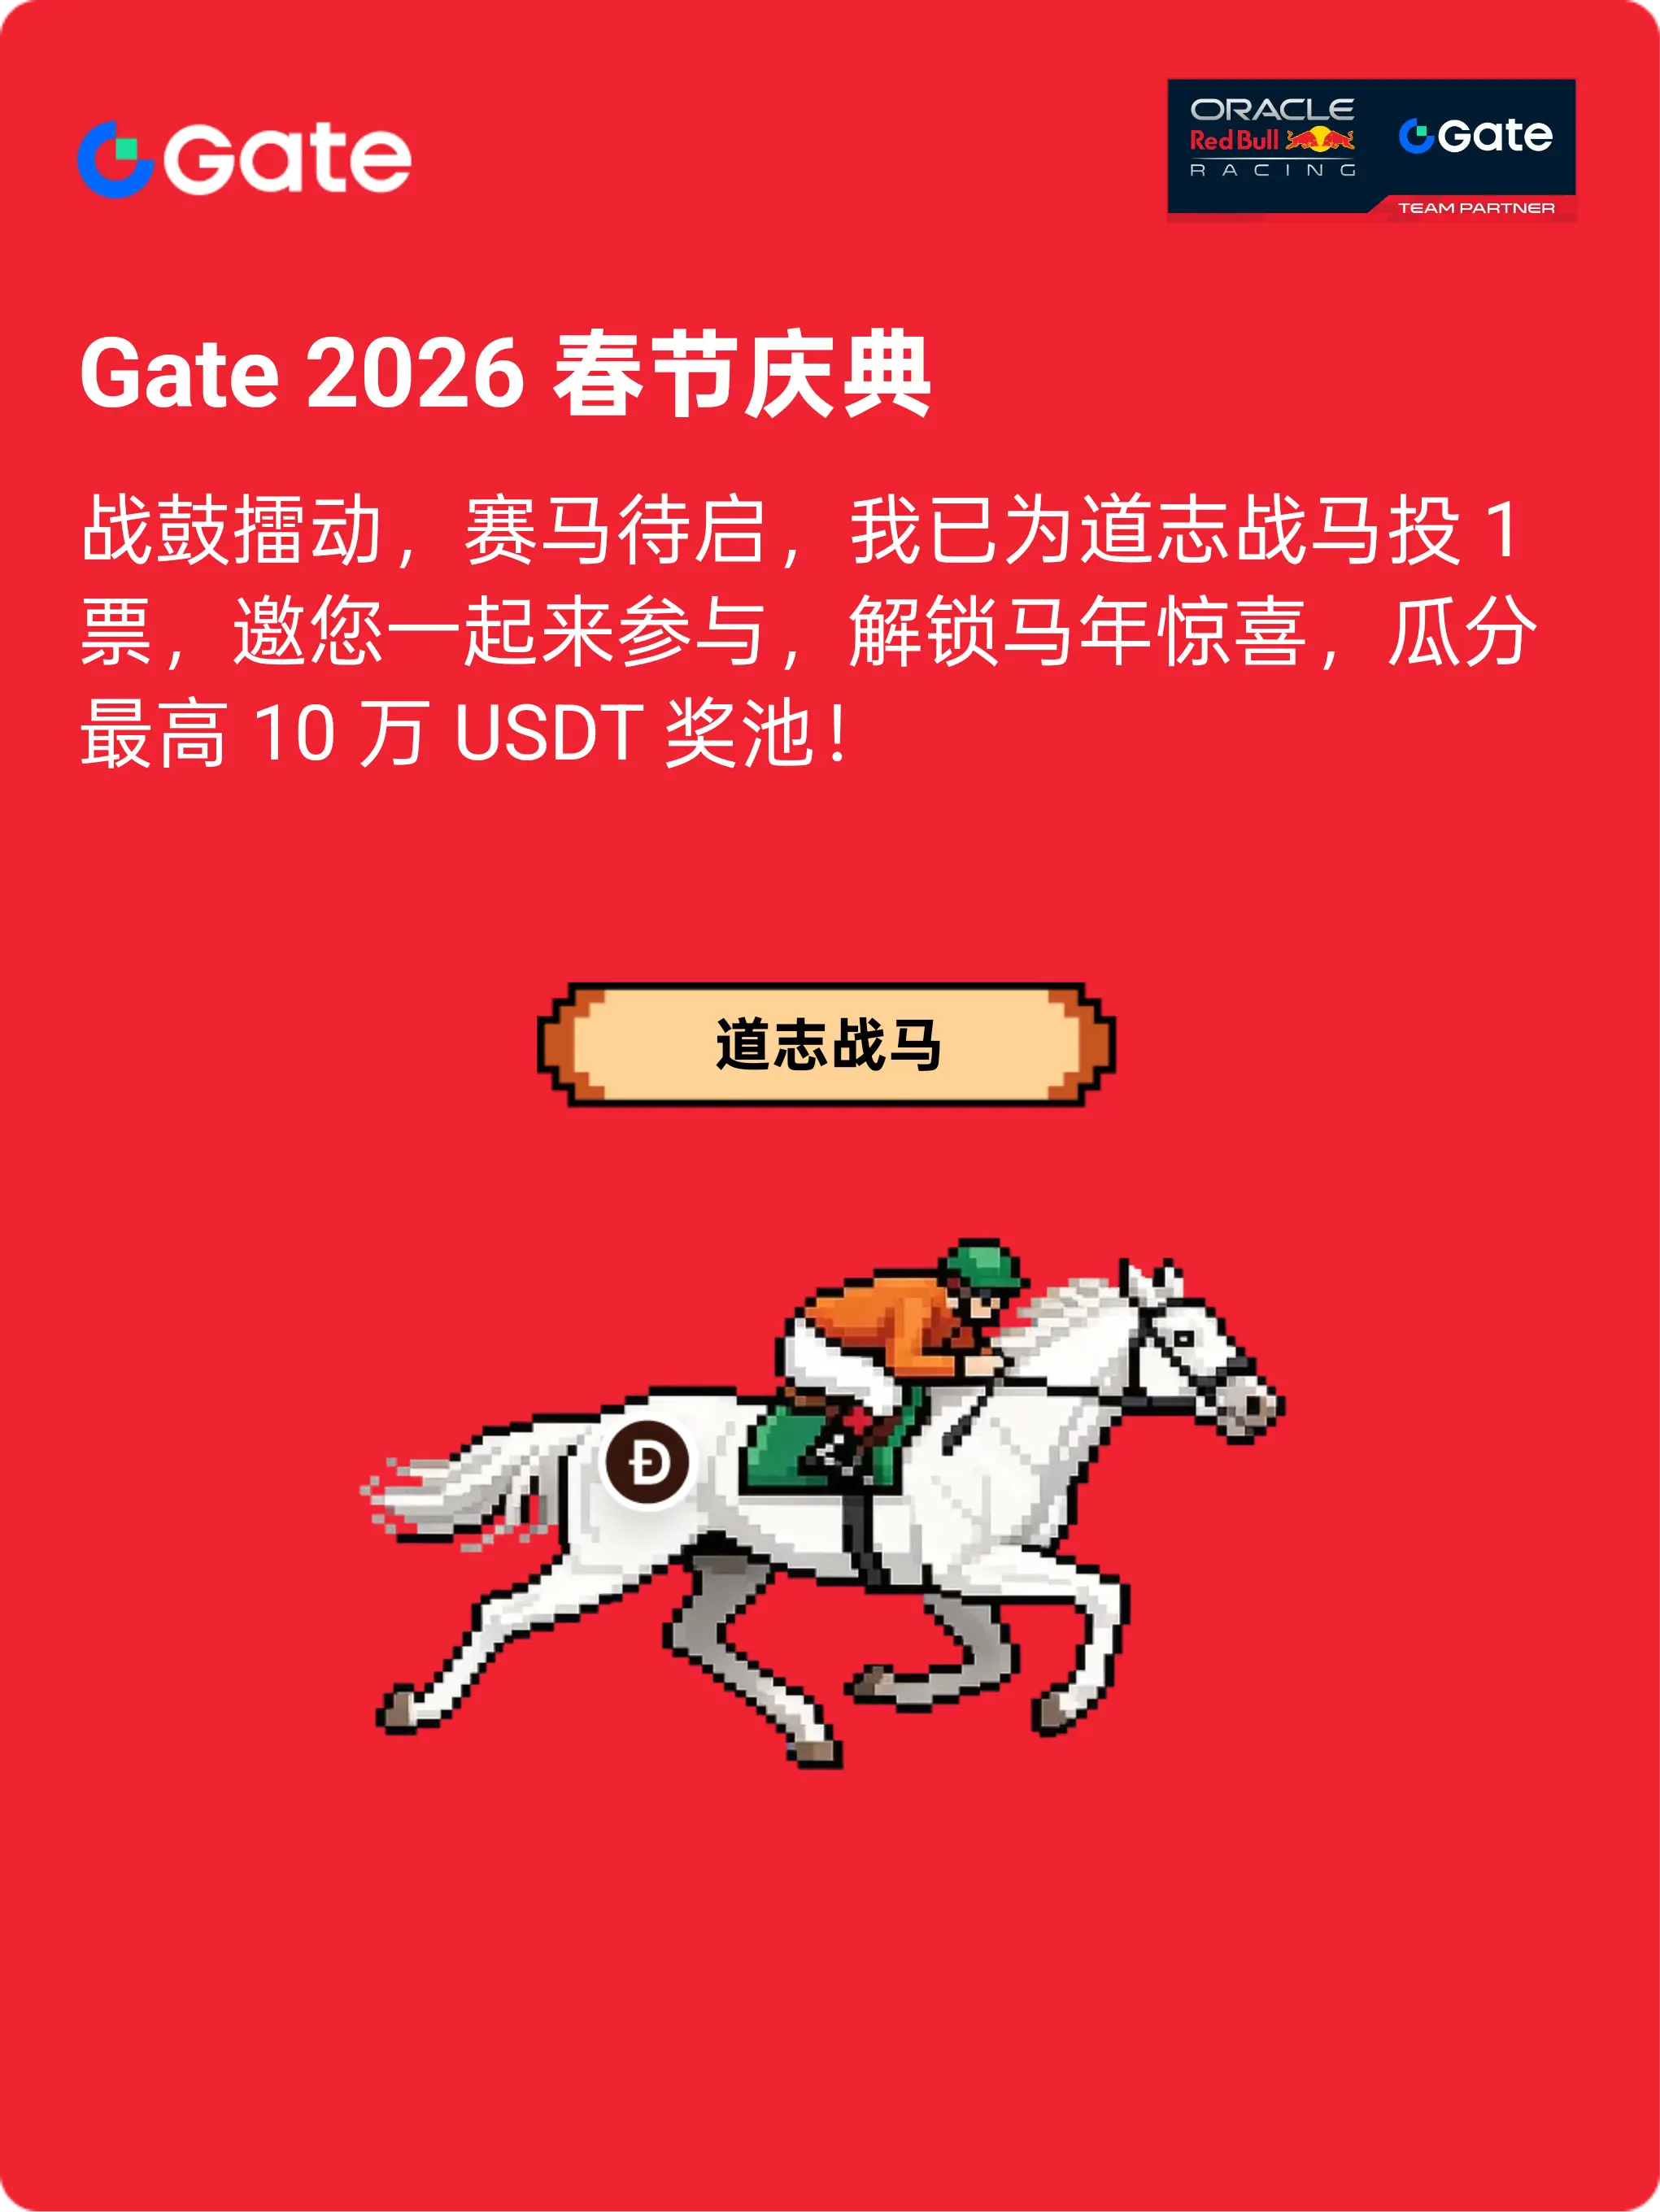
- Reward
- like
- Comment
- Repost
- Share
Participate in horse racing betting, complete tasks to earn horse racing tickets, and enjoy a million red envelope rain daily, sharing a prize pool of 100,000 USDT at the Gate 2026 Spring Festival Celebration. https://www.gate.com/competition/year-of-horse-2026?ref_type=165&utm_cmp=7EQB9Jba&ref=VVZEA1sM
View Original
- Reward
- 1
- Comment
- Repost
- Share
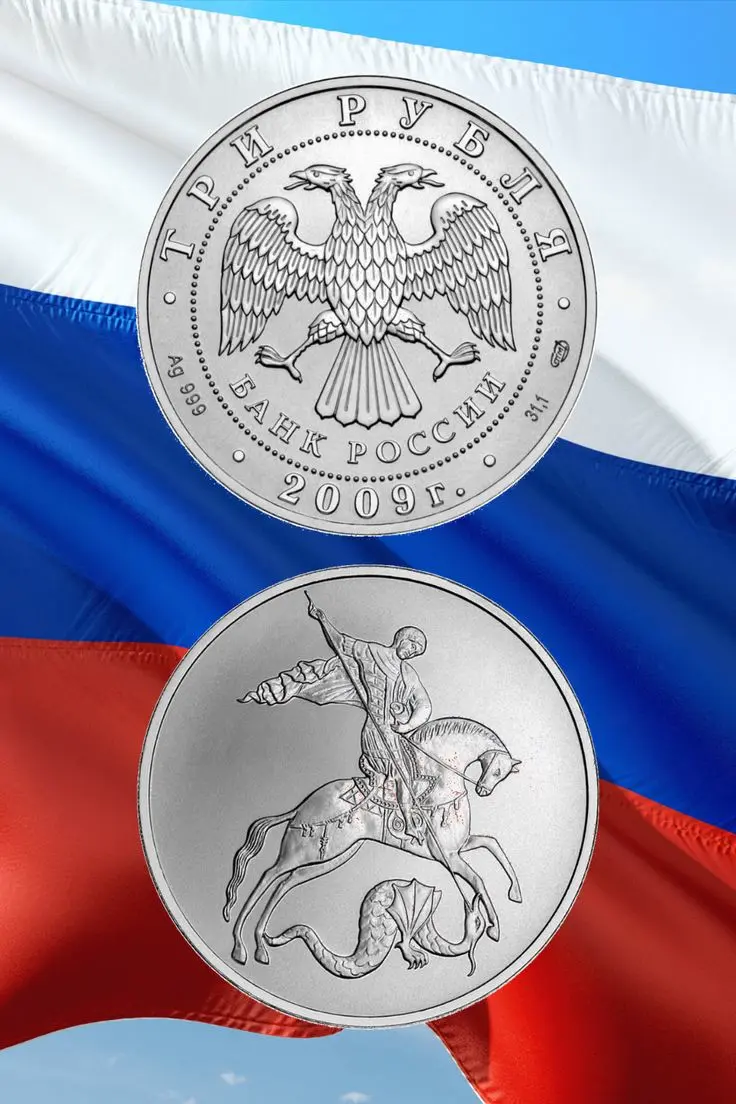
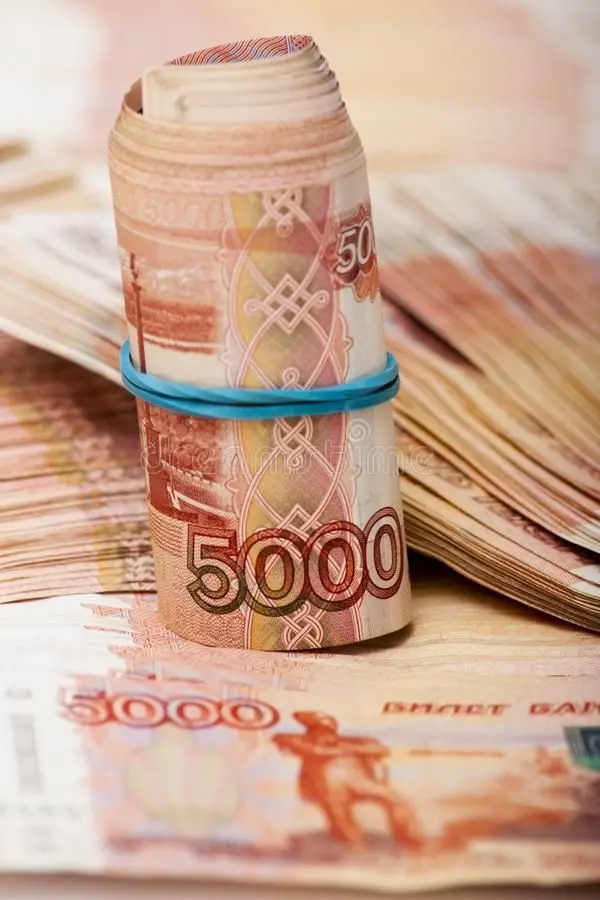
#RussiaStudiesNationalStablecoin
Russia is considering a new approach in the face of the challenges created by sanctions. The Central Bank has begun to seriously consider the idea of issuing a national stablecoin pegged to the ruble. Previously hesitant about such private stablecoins, Russia has now decided to explore its own state-backed version. A detailed review will be conducted in 2026. The aim is to reduce dependence on the dollar in international payments and to ensure faster and more secure trade. Currently, a digital ruble project already exists in Russia and is gradually becoming mo
Russia is considering a new approach in the face of the challenges created by sanctions. The Central Bank has begun to seriously consider the idea of issuing a national stablecoin pegged to the ruble. Previously hesitant about such private stablecoins, Russia has now decided to explore its own state-backed version. A detailed review will be conducted in 2026. The aim is to reduce dependence on the dollar in international payments and to ensure faster and more secure trade. Currently, a digital ruble project already exists in Russia and is gradually becoming mo
- Reward
- 20
- 11
- Repost
- Share
CryptoAlice :
:
2026 GOGOGO 👊View More
Load More
Join 40M users in our growing community
⚡️ Join 40M users in the crypto craze discussion
💬 Engage with your favorite top creators
👍 See what interests you
Trending Topics
View More89.49K Popularity
8.41K Popularity
8.21K Popularity
55.11K Popularity
4.68K Popularity
News
View MoreCZ: This year, some major Chinese competitors have been spending money to smear us, while other industry peers' competition remains relatively professional.
1 m
Data: If BTC drops below $66,242, the total long liquidation strength on mainstream CEXs will reach $1.117 billion.
4 m
Today, the Fear and Greed Index dropped to 8, and the market is in an "extreme fear" state.
5 m
Lighter has expanded the cross-margin mechanism to include the gold and silver markets.
11 m
Galaxy Digital Executive: The crypto market will not experience a V-shaped recovery; it will gradually rise after a period of volatility.
14 m
Pin