Date: Thu, Dec 18, 2025 | 08:50 AM GMT
The broader cryptocurrency market has been experiencing choppy price action over the past several weeks, a phase that began after the sharp sell-off on October 10. That correction dragged** Ethereum (ETH) **down by nearly 22% over the last 60 days, keeping sustained pressure on major altcoins, including Polygon (POL).
POL has dropped more than 10% over the past week and is now down over 43% across the last 60 days. While the short-term trend remains clearly bearish, the higher-timeframe chart is beginning to reveal a technical structure that could be setting the stage for a potential rebound if key levels are reclaimed.
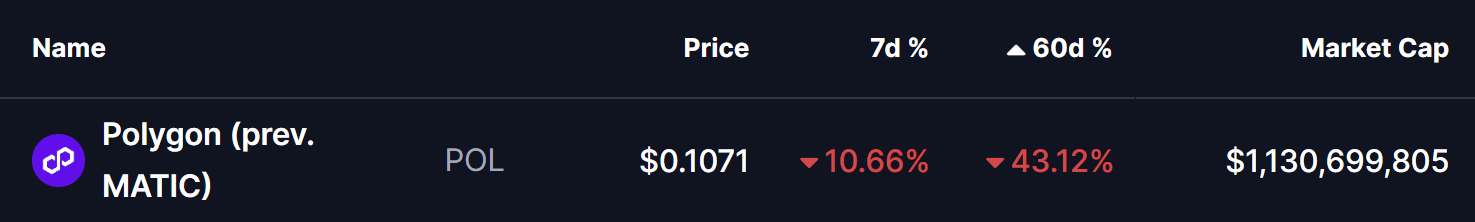
Source: Coinmarketcap
Power of 3 Pattern in Play?
On the weekly chart, POL appears to be forming a classic Power of 3 structure, a pattern often associated with market cycle lows and trend transitions. This setup typically unfolds in three phases — accumulation, manipulation, and expansion — with the most volatile move emerging once the final stage begins.
Accumulation Phase
Earlier in the year, POL spent an extended period consolidating within a well-defined range, capped by resistance near the $0.27 region and supported around the $0.15 zone. This sideways movement reflected an accumulation phase, where volatility compressed and price action became increasingly muted. Such conditions often suggest quiet positioning by larger market participants while broader interest fades and sentiment turns neutral to bearish.
This range-bound behavior laid the groundwork for the next phase of the structure, as liquidity built up on both sides of the market.
Manipulation Phase
During the latest market-wide downturn, POL broke decisively below the $0.15 accumulation support, sliding to a recent low near $0.107. This sharp breakdown, highlighted by the red-shaded area on the chart, aligns closely with the manipulation phase of the Power of 3 pattern. Moves like this are typically designed to trigger stop losses, force capitulation among weaker holders, and push sentiment to pessimistic extremes.
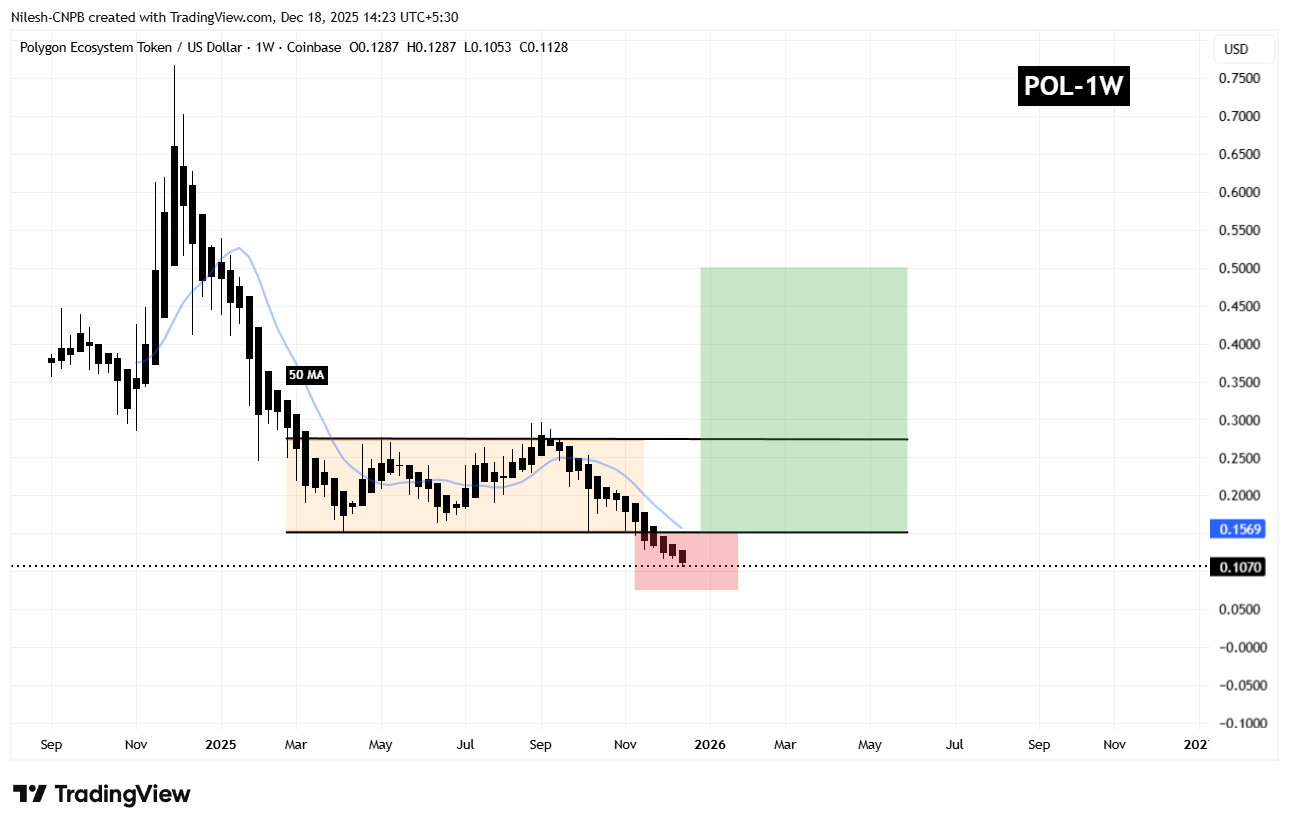
Polygon (POL) Weekly Chart/Coinsprobe (Source: Tradingview)
Notably, the selling pressure has started to lose momentum near this lower zone. Candles are compressing, and downside follow-through appears limited, suggesting that aggressive distribution may be nearing exhaustion.
What’s Next for POL?
At present, POL remains within this manipulation zone, indicating that the market is still probing for direction before committing to a larger move. A brief period of consolidation around current levels would not be unusual, as buyers and sellers continue to battle for control.
For the bullish scenario to gain traction, POL needs to reclaim the $0.15 support zone and move back above the 50-week moving average near $0.1569. A successful recovery above these levels would signal a transition into the expansion phase of the Power of 3 structure, where upside momentum typically accelerates quickly.
If that breakout materializes, the chart projection points toward a potential move into the $0.48–$0.50 region over the coming months, an area that aligns with prior structural resistance.
However, this setup remains conditional. As long as POL continues to trade below $0.15, downside risks cannot be ruled out, and the market remains vulnerable to further volatility. Holding current lows and reclaiming key resistance levels will be critical for bulls to validate the bullish reversal narrative.
Disclaimer: The views and analysis presented in this article are for informational purposes only and reflect the author’s perspective, not financial advice. Technical patterns and indicators discussed are subject to market volatility and may or may not yield the anticipated results. Investors are advised to exercise caution, conduct independent research, and make decisions aligned with their individual risk tolerance.
Disclaimer: The information on this page may come from third parties and does not represent the views or opinions of Gate. The content displayed on this page is for reference only and does not constitute any financial, investment, or legal advice. Gate does not guarantee the accuracy or completeness of the information and shall not be liable for any losses arising from the use of this information. Virtual asset investments carry high risks and are subject to significant price volatility. You may lose all of your invested principal. Please fully understand the relevant risks and make prudent decisions based on your own financial situation and risk tolerance. For details, please refer to
Disclaimer.
Related Articles
Will Bitcoin drop again to $60,000? Four signals point to an increased risk of a pullback.
Bitcoin’s current price is about $68,500. The momentum for a rebound in the near term is weakening, and the technical picture suggests it may be in a consolidation phase within a downtrend. The RSI shows a hidden bearish divergence, and on-chain data warns that core capital confidence has weakened. The derivatives market amplifies the risk of volatility; if the key support level of $68,700 is broken, it could trigger a downside correction and potentially reach lower price ranges.
GateNews10m ago
Bitcoin fell below $68,000 triggering a chain reaction of liquidations, while U.S. Treasury yields approached 4.5%, putting pressure on risk assets.
Bitcoin has weakened again in the past 24 hours, falling below the $68,000 mark, leading to large-scale liquidations of long positions in the market. The liquidation pressure has not been fully released, with significant potential liquidity below $66,000. Rising U.S. Treasury yields and geopolitical instability further suppress the market, while a strengthening dollar also increases pressure on Bitcoin. Future trends will focus on the support situation at $66,000.
GateNews12m ago
Short-term BTC holders' panic selling has cooled down, and the inflow to a certain CEX has dropped to a historic low.
Recently, BTC has slightly rebounded and entered a consolidation phase under geopolitical and economic pressures. The selling sentiment among short-term holders has significantly eased, and the amount of BTC flowing into a certain CEX has dropped to a historic low, indicating that market selling pressure has notably diminished.
GateNews13m ago
Why is the crypto market down today? Middle East conflict escalates; Bitcoin drops below $70,000; liquidations across the entire network total $300 million
On March 27, the crypto market continued to slide. Bitcoin fell below $70,000, and Ethereum and other major assets also generally pulled back. Rising geopolitical risks and higher oil prices weighed on the market. Funds flowed into traditional safe-haven assets, causing investor sentiment to turn cautious. Whether Bitcoin can rebound in the future will depend on changes in the macroeconomic environment.
GateNews22m ago
Nasdaq 100 Sends Rare Signal: 100 Days Below Highs, History Shows Potential 17% Rise in a Year
The NASDAQ-100 has declined by 6.6% since 2023, not reaching its historical high for 100 consecutive trading days, but historical data indicates that a mid-term recovery window is approaching. Institutional inflows have increased, particularly with pensions significantly increasing their stock holdings, providing support to the market. Despite facing macroeconomic uncertainty, conditions for a rebound are gradually accumulating.
GateNews24m ago
XRP's key support level of $1.36 is a watershed: can it rebound by 11% or will it continue to decline?
XRP is currently fluctuating around $1.36, forming a structure of "continuously lower highs," with market sentiment being cautious. The stop-loss behavior of short-term holders has led to weak rebounds, and giant whales reducing their holdings further suppresses market confidence. Although there are bullish divergence signals from a technical perspective, the short-term trend still needs to focus on the support level of $1.36; if it breaks below, a continuation of the adjustment may occur.
GateNews27m ago
