
**Date: **Sat, Jan 03, 2025 | 01:26 PM GMT
As 2026 kicks off, the broader cryptocurrency market is showing renewed stability. Ethereum (ETH) has reclaimed the $3,100 level, and several major altcoins are already beginning to pick up momentum. Against this improving backdrop, Kaspa (KAS) is quietly positioning itself as a potential late mover, with its chart structure starting to flash early bullish signals.
While KAS is trading slightly in the red today and remains mostly flat on the weekly timeframe, the more important story is unfolding beneath the surface. Recent price action suggests a meaningful structural shift may be underway — one that could mark the early stages of a bullish continuation if confirmed.
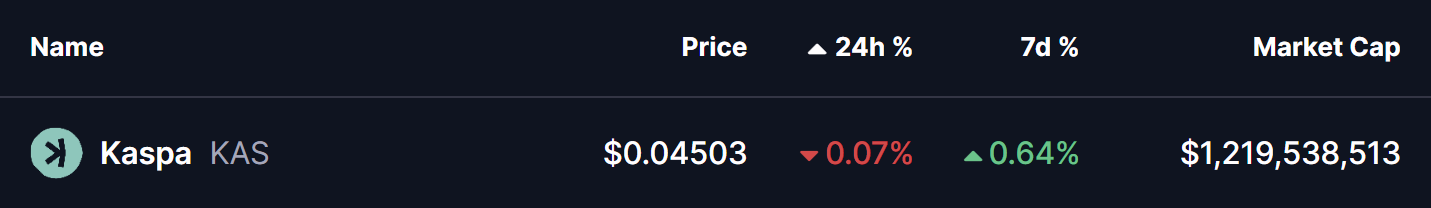
Source: Coinmarketcap
Rounding Bottom in Play
On the 4-hour timeframe, Kaspa appears to be forming a rounding bottom pattern, a classic bullish reversal structure that typically develops after a prolonged corrective phase. This pattern reflects a slow but steady transition from distribution to accumulation, as selling pressure weakens and buyers gradually regain control.
The setup began after KAS faced strong rejection near the $0.06310 neckline zone, which triggered a sharp decline through late November and December. That downside move eventually found strong demand near the $0.040 level, which has since acted as a key support area. Multiple defenses of this zone prevented further downside and helped establish a stable base for a potential trend reversal.
Since carving out that bottom, KAS has started to curve higher in a smooth, rounded fashion — closely matching the textbook structure of a developing rounding bottom. The recent stabilization above the $0.045 region further supports the idea that downside momentum is fading.
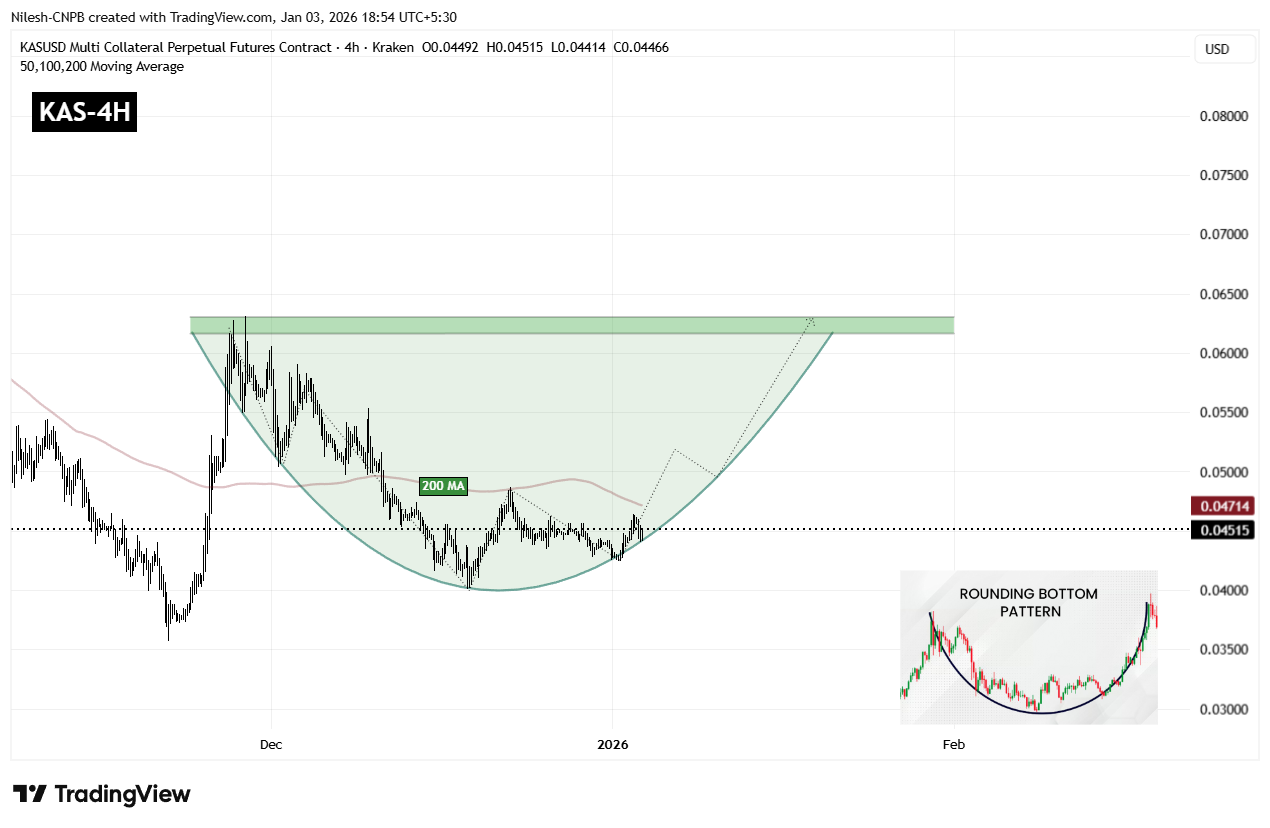
Kaspa (KAS) 4H Chart/Coinsprobe (Source: Tradingview)
A key technical level now comes into focus: the 200-period moving average, currently hovering near $0.04714. This level has acted as dynamic resistance during the recovery phase, and reclaiming it would mark an important shift in short-term market structure.
A sustained move above the 200 MA would indicate that buyers are regaining control after months of corrective price action and could act as the trigger for a stronger upside continuation.
What’s Next for KAS?
For full confirmation of the rounding bottom pattern, KAS must eventually reclaim the $0.06310 neckline resistance. A clean breakout above this zone would validate the entire reversal structure and could open the door to a broader bullish expansion phase, with momentum traders likely re-entering the market.
Until that breakout occurs, the pattern remains in development. Short-term consolidation or shallow pullbacks remain possible, especially near moving average resistance. However, as long as price continues to hold above the $0.04245 support base and maintains higher lows, the broader bottoming structure remains intact and constructive.
In the near term, all eyes remain on the 200 MA and the neckline zone. How Kaspa reacts around these levels will likely determine whether this emerging bullish setup evolves into a confirmed breakout move or requires more time to mature.
Disclaimer: The views and analysis presented in this article are for informational purposes only and reflect the author’s perspective, not financial advice. Technical patterns and indicators discussed are subject to market volatility and may or may not yield the anticipated results. Investors are advised to exercise caution, conduct independent research, and make decisions aligned with their individual risk tolerance.
About Author: Nilesh Hembade is the Founder and Lead Author of Coinsprobe, with over 5 years of experience in the cryptocurrency and blockchain industry. Since launching Coinsprobe in 2023, he has been providing daily, research-driven insights through in-depth market analysis, on-chain data, and technical research.

Disclaimer: The information on this page may come from third parties and does not represent the views or opinions of Gate. The content displayed on this page is for reference only and does not constitute any financial, investment, or legal advice. Gate does not guarantee the accuracy or completeness of the information and shall not be liable for any losses arising from the use of this information. Virtual asset investments carry high risks and are subject to significant price volatility. You may lose all of your invested principal. Please fully understand the relevant risks and make prudent decisions based on your own financial situation and risk tolerance. For details, please refer to
Disclaimer.
Gerelateerde artikelen
Ethereum Spot Volume Surges 72%, Traders Eye $2,600 Liquidity Gap
Abstract: Ethereum's perpetual futures show robust buying pressure, with 24h net taker volume at $5.5B and the highest 30-day average since July 2022. ETH tests $2,400 and eyes a liquidity zone at $2,475–$2,634 as EMAs rise; CVD sits around $12.6B with neutral funding, suggesting a near-term liquidity target in that range.
ETH perpetual futures show strong buying with $5.5B 24h net taker volume and a 30-day high; ETH tests $2,400, aiming for $2,475–$2,634 liquidity zone as EMAs rise; CVD ~ $12.6B, funding neutral.
GateNews20m geleden
Gold and Silver Slip Slightly, Oil Rises; Bitcoin and Ethereum Volatility Indices Decline
Gate News message, April 23 — Gold prices fell to $4,731.95 per ounce with a daily decline of 0.18%, while silver dropped to $77.585 per ounce, down 0.13% intraday. Bitcoin volatility index (BVIX) stood at 43.64, declining 1.80%, and Ethereum volatility index (EVIX) reached 63.90, down 5.19%.
In
GateNews3u geleden
Gate日報(4月23日):美國政府運行比特幣節點;特斯拉BTC持股不變
比特幣(BTC)延續週初反彈態勢,4 月 23 日暫報 78,230 美元左右。美國太平洋司令部司令 Samuel Paparo 在國會聽證會上表示,美國政府運行比特幣節點進行網路安全測試,但未參與挖礦。特斯拉第一季比特幣持股不變,數位資產減損虧損 1.73 億美元。
MarketWhisper3u geleden
Probably Nothing” — But TOTAL2 Structure Points Higher, and These 5 Altcoins Could Lead the Rally
TOTAL2 continues to respect a long-term trendline, signaling underlying altcoin market strength.
Market sentiment remains muted, often a precursor to larger price expansions.
Select altcoins show strong fundamentals despite limited short-term price movement.
The wider altcoin market
CryptoNewsLand3u geleden
川普確認伊朗停火談判「無時間表」,比特幣重探 7.8 萬美元
4 月 23 日,比特幣重探 78,000 美元上方,美國總統川普(Donald Trump)於 4 月 22 日接受福克斯新聞(Fox News)記者瑪莎·麥卡勒姆(Martha MacCallum)採訪時,確認美伊停火談判不設時間表,並否認美媒 Axios 同日援引美國官員所稱的「3 至 5 天窗口期」報道。
MarketWhisper4u geleden
Crypto Fear & Greed Index Rises to 46, Market Remains in Panic State
Crypto Fear & Greed Index rose to 46, maintaining a 'panic' state; up from 32 yesterday, which also indicated panic.
GateNews4u geleden