
Date: Fri, Jan 02, 2026 | 09:15 AM GMT
The broader cryptocurrency market has started the new year on a stable footing, with both Bitcoin (BTC) and Ethereum (ETH) trading slightly higher and posting gains of over 1.5%. This modest strength across major assets has provided breathing room for risk-on sentiment, allowing several memecoins to show early signs of recovery — including Popcat (SOL) (POPCAT).
POPCAT is currently trading by solid 19% higher on the day, but the more important development lies in its broader technical structure. After months of consistent downside pressure, the price action is now beginning to hint at a potential trend reversal, supported by a well-defined bullish pattern forming on the daily chart.
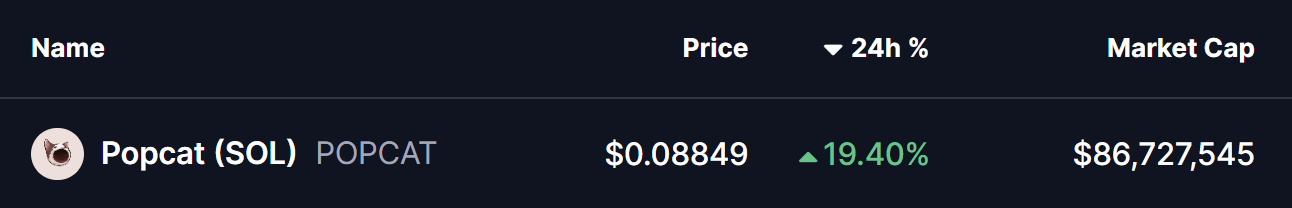
Source: Coinmarketcap
Falling Wedge Pattern in Play
On the daily timeframe, POPCAT appears to be carving out a falling wedge formation — a classic bullish reversal pattern that often develops after extended downtrends. This structure is characterized by lower highs and lower lows that gradually converge, reflecting weakening selling pressure and growing buyer interest near the lows.
Following weeks of steady decline, POPCAT recently established a local bottom near the $0.0725 region. This area acted as a strong demand zone, where buyers stepped in aggressively and prevented further downside. The resulting rebound pushed price back toward the $0.088 level, placing POPCAT just beneath the wedge’s upper resistance trendline.
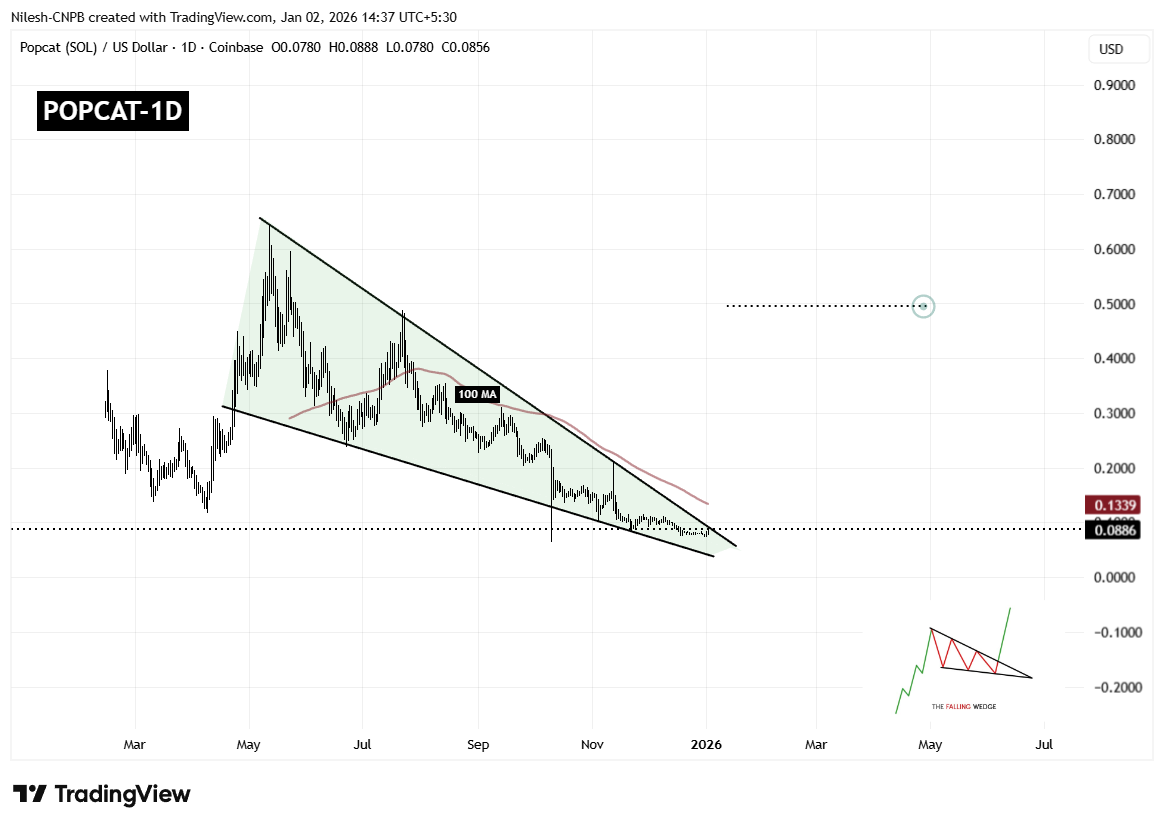
Popcat (POPCAT) Daily Chart/Coinsprobe (Source: Tradingview)
This compression near resistance is technically significant, as falling wedges tend to resolve with a sharp upside move once price breaks out of the structure. The longer price coils within the wedge, the stronger the eventual breakout tends to be.
However, overhead resistance remains notable. The 100-day moving average, currently hovering around $0.1339, represents a major technical barrier. This level has previously acted as dynamic resistance and will likely be a key area to watch if a breakout occurs.
What’s Next for POPCAT?
If buyers manage to push price decisively above the wedge resistance and reclaim the 100-day moving average with a strong daily close, POPCAT could confirm a bullish breakout. Such a move would mark a clear shift in trend structure and could open the door for a larger recovery rally.
Based on the measured move of the falling wedge pattern, the upside projection points toward the $0.49 region. Reaching this level would represent a substantial recovery from current prices and could attract renewed interest from momentum traders and sidelined participants.
That said, failure to break above resistance could result in continued consolidation. In a bearish scenario, POPCAT may revisit the $0.072 support zone once again. As long as this level continues to hold, the broader falling wedge structure would remain intact, keeping the bullish reversal thesis alive.
Overall, POPCAT is approaching a technically critical juncture. With price tightly compressed, selling pressure fading, and buyers defending key support levels, the coming sessions could prove decisive in determining whether this memecoin is ready to stage its next meaningful move higher.
Disclaimer: The views and analysis presented in this article are for informational purposes only and reflect the author’s perspective, not financial advice. Technical patterns and indicators discussed are subject to market volatility and may or may not yield the anticipated results. Investors are advised to exercise caution, conduct independent research, and make decisions aligned with their individual risk tolerance.
About Author: Nilesh Hembade is the Founder and Lead Author of Coinsprobe, with over 5 years of experience in the cryptocurrency and blockchain industry. Since launching Coinsprobe in 2023, he has been providing daily, research-driven insights through in-depth market analysis, on-chain data, and technical research.
Disclaimer: The information on this page may come from third parties and does not represent the views or opinions of Gate. The content displayed on this page is for reference only and does not constitute any financial, investment, or legal advice. Gate does not guarantee the accuracy or completeness of the information and shall not be liable for any losses arising from the use of this information. Virtual asset investments carry high risks and are subject to significant price volatility. You may lose all of your invested principal. Please fully understand the relevant risks and make prudent decisions based on your own financial situation and risk tolerance. For details, please refer to
Disclaimer.
Gerelateerde artikelen
SUI Price Stabilizes Near Support After Multi-Week Pullback
March 9, 2026 5:00 am EDT
TheCoinRepublic13m geleden
XRP Futures Market Signals Exchange Outflow and Volatility - U.Today
XRP is experiencing a notable market shift with a significant exchange outflow of over $738 million, indicating cautious buyer sentiment. Despite minor volatility, the asset shows signs of stability and growth potential, supported by Ripple Labs' initiatives in DeFi.
UToday48m geleden
Ripple’s XRP Price Could Outperform Bitcoin if 0.000017 BTC Breaks
For many years, XRP has struggled to keep up with Bitcoin when measured against the BTC pair. However, a new analysis suggests the long period of underperformance may be approaching a turning point.
Top analyst Egrag Crypto showed a hidden liquidity cycle can be observed on the chart of the XR
CaptainAltcoin53m geleden
地緣政治大動盪!達利歐高呼「黃金才是唯一真神」、避險表現卻跑輸比特幣
在中東地緣政治緊張升溫之際,橋水創辦人達利歐重申黃金的優越性,對比特幣表達質疑,指出其缺乏央行背書等問題。儘管如此,市場反應卻不如他預期,黃金大幅下跌,而比特幣則穩中有升,顯示兩者走勢已脫鉤。達利歐對加密貨幣的看法並未完全看空,仍為資產多樣化保留少量比特幣。
区块客1u geleden
NYDIG: Mối tương quan giữa Bitcoin và cổ phiếu công nghệ bị thổi phồng quá mức
Theo nhận định từ công ty dịch vụ tài chính NYDIG, sự tương đồng gần đây giữa Bitcoin và cổ phiếu ngành phần mềm Mỹ chủ yếu xuất phát từ việc cả hai cùng chịu tác động từ các yếu tố vĩ mô, thay vì phản ánh bất kỳ sự hội tụ mang tính cấu trúc nào.
Trong tuần qua, giá Bitcoin (BTC) đã tăng trưởng cùn
TapChiBitcoin1u geleden
Dogecoin, Pepe, and Shiba Inu Slide as Bitcoin Falls Below $70K
Bitcoin's drop below $70K triggers a selloff in meme coins like Dogecoin and Shiba Inu, causing increased market volatility. Despite a surge in Shiba Inu's burn activity, its price declines alongside Dogecoin, which struggles with weak momentum.
CryptoBreaking2u geleden