
**Date: **Wed, Jan 07, 2026 | 06:20 AM GMT
The broader cryptocurrency market continues to show strong New Year momentum, with Bitcoin (BTC) up around 4% and Ethereum (ETH) gaining over 9% on a weekly basis. This improving sentiment is gradually spilling over into major altcoins — including the DePIN-focused token Akash Network (AKT).
AKT has already posted an impressive 20% weekly gain. While this short-term strength has caught traders’ attention, the more important development is unfolding on the higher-timeframe chart. Recent price action suggests a meaningful shift in market structure, hinting that AKT may be transitioning out of a prolonged corrective phase and into the early stages of a bullish continuation.
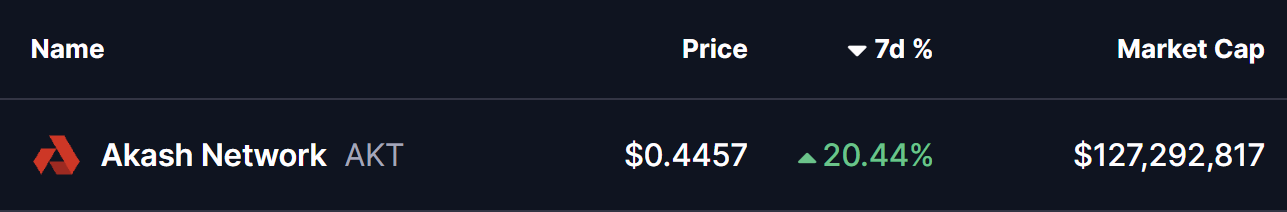
Source: Coinmarketcap
Falling Wedge and Rounding Bottom in Play
On the daily chart, AKT has been trading within a broader falling wedge — a structure that often precedes bullish reversals as selling pressure gradually weakens. Within this larger wedge, price action is also shaping a developing rounding bottom pattern, reflecting steady accumulation and seller exhaustion.
The formation began after AKT faced strong rejection near the $0.5441 resistance zone in late November. That rejection triggered a sharp sell-off, pushing price lower toward the $0.3465 region. However, bears failed to extend losses beyond this area. Instead, demand stepped in, downside momentum slowed, and price began to stabilize.
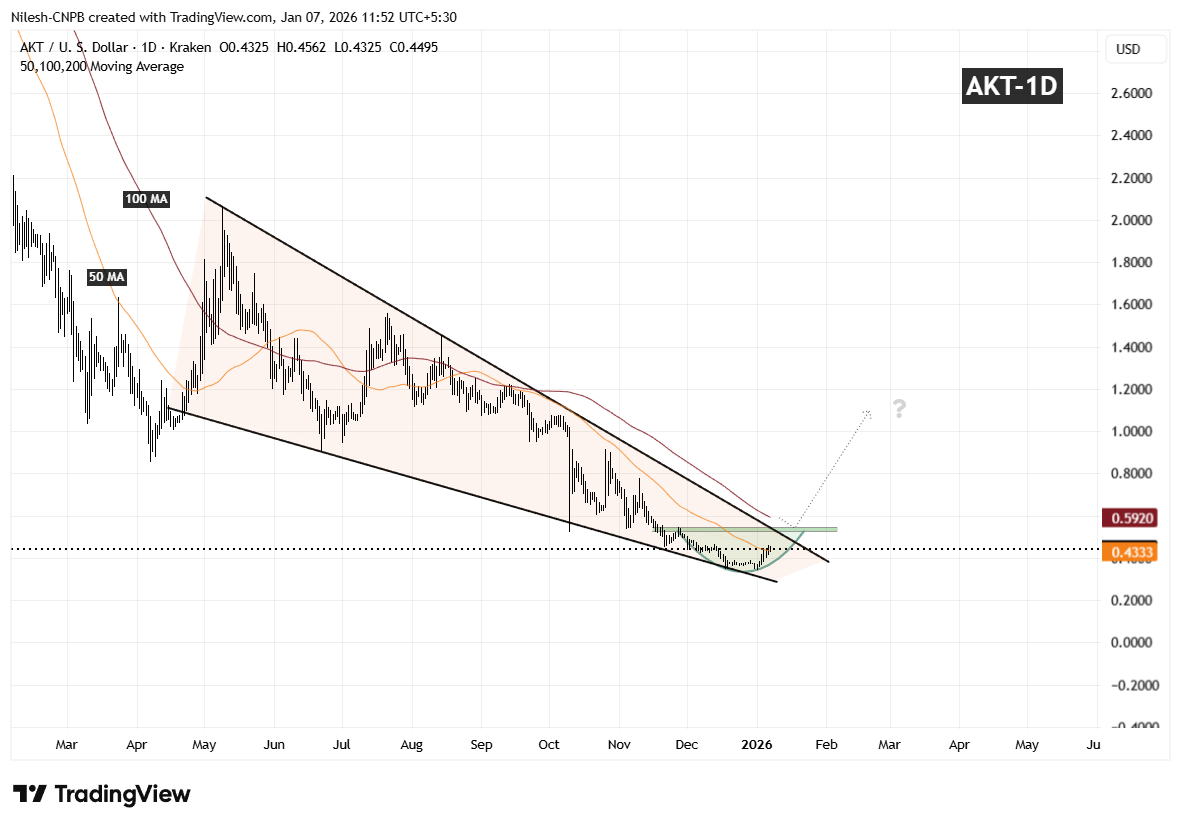
Akash Network (AKT) Daily Chart/Coinsprobe (Source: Tradingview)
Over the following weeks, volatility compressed and AKT started to curl higher in a smooth, rounded fashion — closely matching the textbook behavior of a rounding bottom. Importantly, the recent rebound has pushed price back above the 50-day moving average around $0.4333, a level that had previously acted as resistance and is now beginning to flip into support.
What’s Next for AKT?
If AKT can continue to hold above the 50-day moving average, this area may act as a solid base for further upside attempts. From here, attention shifts toward the descending resistance trendline of the falling wedge, which aligns closely with the $0.5441 resistance zone.
A clean and decisive breakout above this confluence area, followed by sustained acceptance, would confirm a broader bullish expansion phase and mark a clear trend reversal from the prior downtrend. Such a move would likely attract renewed momentum participation as the market recognizes the structural shift.
Until that breakout occurs, the pattern remains in development. Short-term consolidation or shallow pullbacks are still possible as price digests recent gains. However, as long as AKT continues to print higher lows above the established base, the broader technical structure remains constructive.
Overall, the chart suggests AKT is approaching a critical inflection point — one that could determine whether this recovery evolves into a sustained bullish trend as 2026 progresses.
Disclaimer: The views and analysis presented in this article are for informational purposes only and reflect the author’s perspective, not financial advice. Technical patterns and indicators discussed are subject to market volatility and may or may not yield the anticipated results. Investors are advised to exercise caution, conduct independent research, and make decisions aligned with their individual risk tolerance.
About Author: Nilesh Hembade is the Founder and Lead Author of Coinsprobe, with over 5 years of experience in the cryptocurrency and blockchain industry. Since launching Coinsprobe in 2023, he has been providing daily, research-driven insights through in-depth market analysis, on-chain data, and technical research.
Disclaimer: The information on this page may come from third parties and does not represent the views or opinions of Gate. The content displayed on this page is for reference only and does not constitute any financial, investment, or legal advice. Gate does not guarantee the accuracy or completeness of the information and shall not be liable for any losses arising from the use of this information. Virtual asset investments carry high risks and are subject to significant price volatility. You may lose all of your invested principal. Please fully understand the relevant risks and make prudent decisions based on your own financial situation and risk tolerance. For details, please refer to
Disclaimer.
Gerelateerde artikelen
Ethereum Liquid Supply Hits 2024 Low on Binance
Abstract: CryptoQuant reports a notable contraction in Ethereum's liquid supply on Binance, with liquid ETH dropping to about 534,000 from a total reserve of 3.44 million. The trend, termed liquidity dryup, could reduce near-term selling pressure and provide price support if demand improves.
Summary: CryptoQuant notes Binance's ETH liquid supply fell to ~534k of 3.44M total, signaling a liquidity dryup that could ease selling pressure and support prices if demand strengthens.
CryptoFrontier3u geleden
$78,000 BTC Price Support Level Reclaimed, Bitcoin Could Be Entering Bullish Reversal Stage
Bitcoin reclaiming $78k fuels a bullish reversal narrative and potential altseason, with bulls eyeing new ATHs up to $126k–$140k while bears warn of a fake pump before a cycle bottom.
Abstract: The article discusses Bitcoin reclaiming the $78,000 level as a potential bullish reversal that could spur altcoin rallies, outlining bullish and bearish forecasts, possible new ATHs, and rising market optimism.
CryptoNewsLand3u geleden
Altcoin Trading Volume Share Hits Two-Month High at 51% on Major CEX
Gate News message, April 22 — According to analyst Darkfost, altcoin trading volume share on a major centralized exchange reached 51%, up significantly from 31% in early March, while Bitcoin and Ethereum shares fell to 30% and 17% respectively.
Ethereum's trading volume share declined sharply from
GateNews4u geleden
比特币突破 78,000 美元,以太坊站上 2,390 美元:市场恐慌情绪退潮
比特币突破 78,000 美元,以太坊站上 2,390 美元。本文复盘 4 月 13 日至 22 日的 V 型反转走势,解析爆仓数据与恐惧贪婪指数的演变轨迹。
GateInstantTrends5u geleden
SHIB Struggles to Recover as Fresh Developments Fail to Lift Price Action
SHIB trading activity rises, but price stays trapped in a tight consolidation range.
Whale accumulation increases while some long-term holders, including Aoki, exit positions.
Strong derivatives volume and inflows fail
CryptoNewsLand7u geleden
Macro Recovery Drives Risk Asset Inflows; Crypto Market Shows Divergence Between Mainstream and Altcoins
Global risk appetite rose on easing Middle East tensions, lower energy prices, and strong institutional support, pushing equities to new highs; gold held gains while crypto and ETFs posted modest moves.
Global risk sentiment improved as tensions eased and energy prices fell, with equities at highs, gold firm, and crypto modestly higher; regulatory steps included France backing euro stablecoins and Circle's USDC Bridge.
GateNews8u geleden