 The post Is KAIA Price Setting Up for a Trend Shift & Jump 150%? appeared first on Coinpedia Fintech News
The KAIA price recorded a 39% intraday jump, making it the top asset of the day on the top 100 assets list. It has moved particularly into focus after a sharp 6-7 times rise in derivatives activity, spot volume, and on-chain engagement was witnessed. As capital flows accelerate and network usage improves, this clearly reflects demand. As a result, market participants are keeping KAIA on the watchlist.
KAIA Price Strengthens as Derivatives Activity Surges
Momentum around KAIA price has intensified as futures markets light up. Data from CoinGlass shows derivatives volume surged over 1,000% to approximately $545 million, while open interest climbed nearly 269% to $40 million. Notably, the long/short ratio rose above parity to 1.019, signaling bullish dominance among top traders, particularly on Binance.
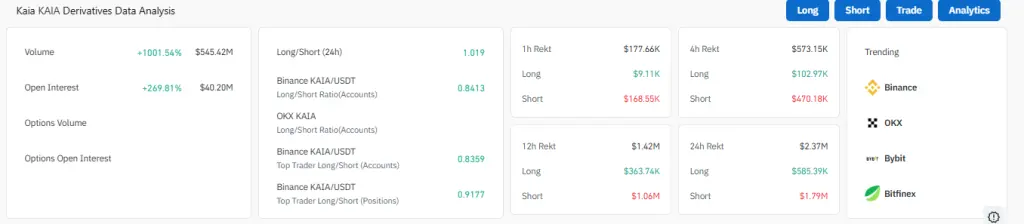
![]() When rising open interest accompanies increasing volume, it typically reflects fresh capital entering the market rather than traders merely rotating positions. As a result, the recent expansion points toward heightened conviction rather than short-lived volatility, reinforcing the short-term KAIA price forecast.
When rising open interest accompanies increasing volume, it typically reflects fresh capital entering the market rather than traders merely rotating positions. As a result, the recent expansion points toward heightened conviction rather than short-lived volatility, reinforcing the short-term KAIA price forecast.
In addition to futures activity, spot market metrics have mirrored the bullish tone. At press time, 24-hour spot volume reached roughly $145 million, while the liquidity ratio rose to 27.1%, indicating deeper order books and improved trade efficiency.
 Such conditions often support price stability during rallies, as higher liquidity reduces slippage and attracts larger participants
Therefore, the alignment between derivatives and spot data suggests growing demand rather than speculative imbalance, strengthening the overall KAIA crypto outlook.
Social and Development Activity Add Fundamental Support
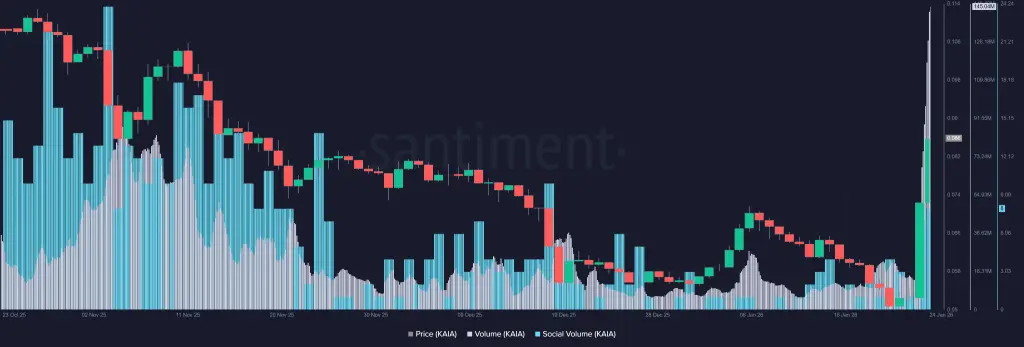
On-chain and santiment indicators have also improved. Social volume surged notably this week as discussions around KAIA increased across X, highlighting rising retail attention
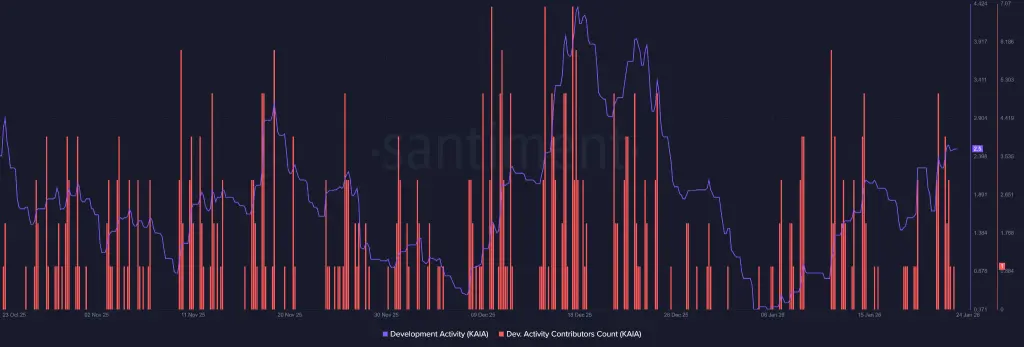 Meanwhile, development activity and development count have trended higher, signaling active progress behind the scenes.
Historically, periods where social engagement rises alongside development growth have coincided with expanding ecosystems rather than temporary hype. Consequently, this backdrop provides additional support to the current KAIA price USD structure.
Gaming Integration Acts as a Near-Term Catalyst
Beyond market data, real-world developments have contributed to the upside. KAIA received a boost after Metabora Games partnered with Noestallagames to launch the Web3 title Magic Squad. Crucially, the game introduced gas abstraction via the KAIA wallet, allowing users to transact without holding KAIA tokens.
 We’re excited to welcome Magic Squad (@_MagicSquad_) to the @KaiaChain ecosystem!
Build heroes. Form squads. Win together.
Team up with other players, battle waves and bosses, and join massive Burst Battles for huge rewards — all on LINE’s Dapp Portal (@dapp_portal).
 … pic.twitter.com/ppQSNbiJgs
— Play on Kaia (@PlayonKaia) January 20, 2026
This lowers entry barriers for mainstream users and enhances usability, potentially increasing transaction throughput and on-chain engagement. As adoption-focused integrations tend to drive organic usage, this development adds weight to the medium-term KAIA price prediction narrative.
KAIA Price Chart Signals a Technical Turning Point
From a technical standpoint, the KAIA price chart shows a decisive breakout from a multi-month descending channel. Price has reclaimed both the 20-day and 50-day EMAs and is now approaching the 200-day EMA band near a key resistance zone.
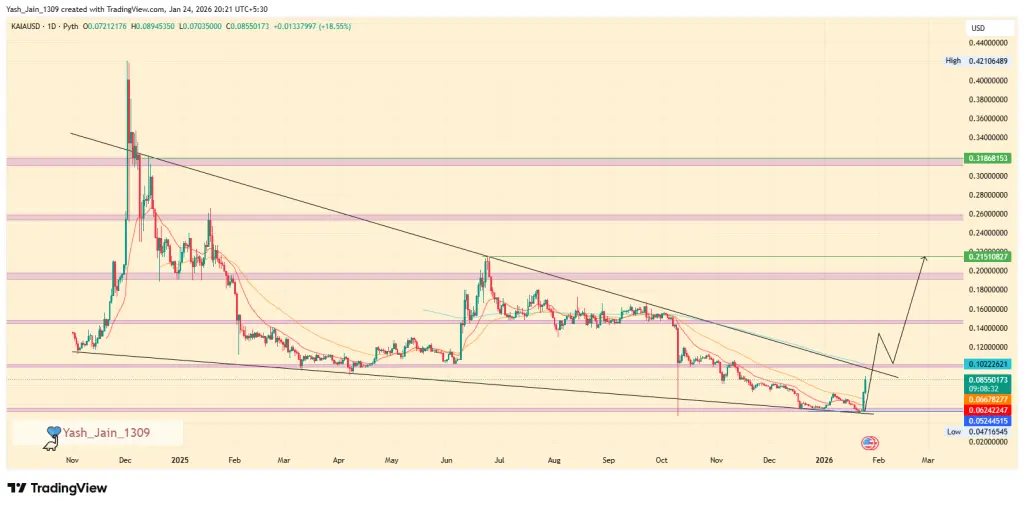 At around $0.085 with a market cap close to $534 million, a successful flip of the 200-day EMA aligned with the channel’s upper boundary and it could open a path toward the $0.21 area, implying a potential 150% extension. Conversely, rejection at this level may result in further consolidation as the market absorbs recent gains, keeping the KAIA price structure constructive but range-bound.
Disclaimer: The information on this page may come from third parties and does not represent the views or opinions of Gate. The content displayed on this page is for reference only and does not constitute any financial, investment, or legal advice. Gate does not guarantee the accuracy or completeness of the information and shall not be liable for any losses arising from the use of this information. Virtual asset investments carry high risks and are subject to significant price volatility. You may lose all of your invested principal. Please fully understand the relevant risks and make prudent decisions based on your own financial situation and risk tolerance. For details, please refer to
Disclaimer.
Gerelateerde artikelen
Bitcoin 8-Hour Average Funding Rate Turns Negative at -0.01%
Gate News message, April 22 — According to Coinglass data, Bitcoin's 8-hour average funding rate across the network currently stands at -0.01%, indicating a slight bearish sentiment among futures traders.
Among major exchanges, funding rates vary: one exchange at -0.0007%, another at -0.0033%, a th
GateNews7u geleden
BTC 24H上涨 5.01%,现价 79399.3 USDT
Gate News bot 消息,Gate 行情显示,BTC 24 小时 上涨 5.01%,现价 79399.3 USDT。
CryptoRadar7u geleden
MicroStrategy Could Drive Bitcoin to $10M If It Accumulates 7.5% Supply, Saylor Says
MicroStrategy aims for 7.5% of Bitcoin supply, implying $10M per BTC; as of Apr 19 it held 815,061 BTC (~3.88%) for $61.56B, needing ~3.62% more to target saturation in Saylor’s long‑term accumulation plan.
Abstract: MicroStrategy seeks to accumulate roughly 7.5% of Bitcoin supply, a threshold Saylor suggests could push BTC to about $10 million and slow purchases thereafter. By April 19 it owned 815,061 BTC (≈3.88% of supply) for $61.56B and would require about 3.62 percentage points more to reach the target, indicating a approaching saturation of its long-run accumulation strategy.
GateNews8u geleden
Bitcoin Liquidation Levels: $28.21B Long Liquidations at $74,951, $16.13B Short Liquidations at $82,741
Gate News message, April 22 — According to Coinglass data, if Bitcoin falls below $74,951, cumulative long liquidations across major centralized exchanges would reach $28.21 billion.
Conversely, if BTC breaks above $82,741, cumulative short liquidations across major CEXs would reach $16.13 billion.
GateNews9u geleden
Bitcoin and Ethereum Spot ETFs Record Consecutive Net Inflows; BTC ETFs Reach $99.08B in Assets
Abstract: Bitcoin and Ethereum spot ETFs posted net inflows on Apr 21, extending multi-day streaks. BTC inflows were led by BlackRock’s IBIT and Grayscale, with GBTC outflows; ETH inflows were led by ETHA, with ETHE outflows.
Summary: Bitcoin and Ethereum spot ETFs posted Apr 21 inflows, extending gains; BTC led by IBIT and Grayscale with GBTC outflows, NAV $99.08B (6.54%). ETH inflows topped by ETHA, ETHE outflows; NAV $13.66B, inflows $12.05B.
GateNews9u geleden
Expert Observes a Bullish 90-Day Bitcoin Pattern Repeating, BTC Could Hit $145,000 ATH Target
Expert observes a bullish 90-day Bitcoin pattern repeating.
He declares accumulation phase complete and expects manipulation phase to start.
BTC could hit $145,000 ATH target in the final distribution phase.
The crypto market has been moving in an upwards direction after weeks of
CryptoNewsLand9u geleden