
Key Takeaways
-
Algorand (ALGO) is consolidating after a 13% decline over the past 60 days, while showing stabilization in the last month.
-
The daily chart reveals a repeating bullish fractal, similar to the setup that triggered ALGO’s 300% rally in November 2024.
-
Price is holding inside a long-term accumulation zone between $0.11 and $0.1530.
-
The 200-day moving average near $0.1912 is acting as key resistance and breakout confirmation level.
-
A successful reclaim of the 200 MA could open the path toward $0.60 and the ascending resistance trendline, while a drop below $0.11 would invalidate the bullish setup.
ALGO, the native token of Algorand’s Layer-1 blockchain, has shown steady but muted momentum over the past 30 days, helping slow down its broader correction. Despite this stabilization, ALGO remains down more than 13% over the last 60 days, keeping sentiment cautious across the market.
That said, when looking beyond short-term price noise, the daily chart is beginning to tell a familiar story. The current structure closely resembles a bullish fractal that, in the past, preceded a powerful breakout rally—raising an important question for traders: is this just consolidation, or a quiet accumulation phase before the next move?
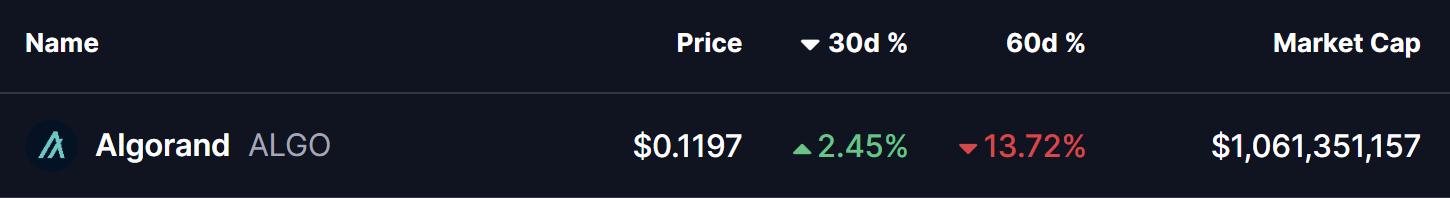
Source: Coinmarketcap
Fractal Setup Hints at a Bullish Reversal
On the daily timeframe, ALGO is displaying early signs of a repeating bullish structure, built around three key technical elements:
-
A rejection from the long-term ascending resistance trendline
-
A prolonged accumulation zone at major historical support
-
A potential reclaim of the 200-day moving average
The current corrective phase began in December 2024, when ALGO was rejected near the ascending resistance trendline around $0.60. That rejection triggered a deep pullback of more than 80%, eventually driving price back into the long-term demand zone between $0.11 and $0.1530—a region that has repeatedly acted as an accumulation area on the chart.
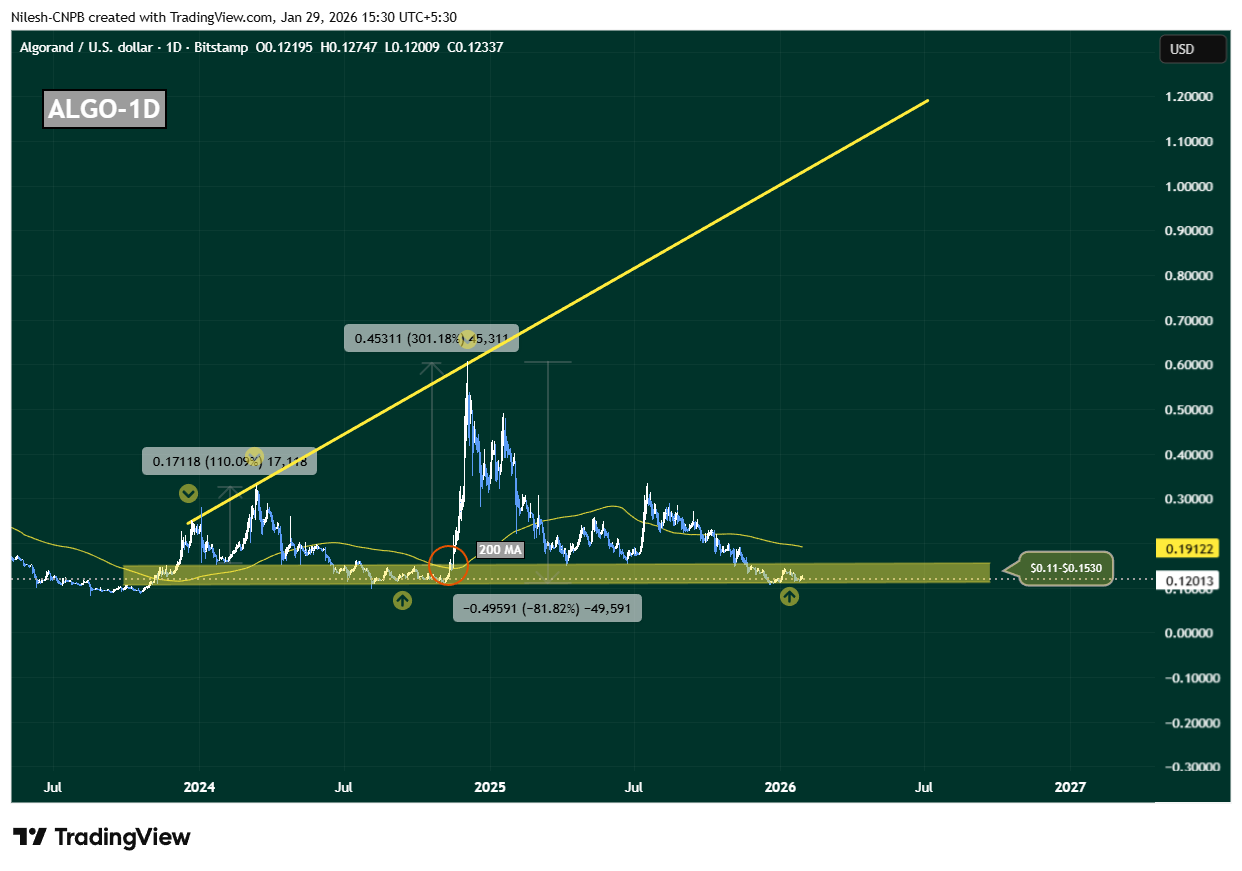
Algorand (ALGO) Daily Chart/Coinsprobe (Source: Tradingview)
This zone is not just technically important; it has also served as a launchpad during previous cycles, where downside momentum stalled and long-term buyers quietly stepped in.
History Rhymes on the ALGO Chart
What makes this setup particularly compelling is how closely it mirrors November 2024’s breakout structure. Back then, ALGO spent extended time consolidating near the same support band before reclaiming the 200-day moving average. Once that level flipped into support, price accelerated sharply—resulting in a 300% rally toward the ascending resistance trendline.
Today, ALGO is once again compressing inside this accumulation range, while the 200-day moving average sits overhead near $0.1912, acting as dynamic resistance. This alignment suggests the market may be approaching another inflection point.
What’s Next for ALGO?
At present, ALGO is hovering near $0.12, firmly inside its long-term accumulation zone. As long as price holds above this region, the broader bullish fractal remains intact.
A clean and sustained reclaim of the 200-day moving average around $0.1912 would be a critical confirmation signal. If bulls manage to flip this level into support, it would closely replicate previous breakout conditions and could trigger a sharp upside expansion. In that scenario, $0.60 becomes a realistic medium-term target, with further upside possible toward the ascending resistance trendline if momentum builds.
However, the structure is not without risk. A decisive breakdown below $0.11 would weaken the accumulation thesis, signal loss of long-term support, and open the door for deeper downside.
For now, ALGO sits at a make-or-break zone. The chart suggests patience is key—but if history repeats, this quiet phase may not last much longer.
Disclaimer: The views and analysis presented in this article are for informational purposes only and reflect the author’s perspective, not financial advice. Technical patterns and indicators discussed are subject to market volatility and may or may not yield the anticipated results. Investors are advised to exercise caution, conduct independent research, and make decisions aligned with their individual risk tolerance.
About Author: Nilesh Hembade is the Founder and Lead Author of Coinsprobe, with over 5 years of experience in the cryptocurrency and blockchain industry. Since launching Coinsprobe in 2023, he has been providing daily, research-driven insights through in-depth market analysis, on-chain data, and technical research.
Disclaimer: The information on this page may come from third parties and does not represent the views or opinions of Gate. The content displayed on this page is for reference only and does not constitute any financial, investment, or legal advice. Gate does not guarantee the accuracy or completeness of the information and shall not be liable for any losses arising from the use of this information. Virtual asset investments carry high risks and are subject to significant price volatility. You may lose all of your invested principal. Please fully understand the relevant risks and make prudent decisions based on your own financial situation and risk tolerance. For details, please refer to
Disclaimer.
Gerelateerde artikelen
Crypto Fear & Greed Index Rises to 46, Market Remains in Panic State
Crypto Fear & Greed Index rose to 46, maintaining a 'panic' state; up from 32 yesterday, which also indicated panic.
GateNews6m geleden
Grayscale Hints at Bull Market Setup as Bitcoin Holds Critical Breakeven Level
Bitcoin markets are showing signs of a potential bottom as improving price action brings recent buyers back to breakeven. Grayscale points to strengthening positioning as a key signal that sentiment may be shifting toward more bullish conditions.
Key Takeaways:
Grayscale signaled bitcoin may
Coinpedia13m geleden
比特幣上衝 79K,川普延長停火協議,樂觀財報引領美股再創新高
標普與那指昨日再創新高,受美伊停火延長及樂觀財報提振。加密貨幣同步走高,BTC 一度衝上 79,472 美元、ETH 站上 2,400 美元,24 小時漲幅 3.04%。比特幣遭高額清算達 4.21 億美元,若能穩住 78.1K 真實價值,或有望突破 80K,展現上漲動能。
ChainNewsAbmedia1u geleden
ADA Price Outlook as Cardano Lands LSE Tokenized Deal
Key Insights
Cardano tokenized a Hannover Re reinsurance product and listed it on the London Stock Exchange, expanding blockchain use in regulated institutional markets.
ADA price holds within a descending wedge as support at $0.2400 remains intact while resistance near $0.2550 and $0.2824 l
CryptoNewsLand5u geleden
SUI Price Eyes $1.10 Breakout as Whale Positions Rise
Key Insights
SUI trades at $0.96 with RSI at 53.66, showing neutral momentum while maintaining upside room for expansion toward resistance levels.
Whale positioning at 70% long signals strong institutional confidence, aligning with rising open interest and steady capital inflows despite
CryptoNewsLand5u geleden
Shiba Inu Open Interest Surges 13.45% in 24 Hours as Futures Activity Accelerates
SHIB open interest rose 13.45% to $69.79M with price up ~3% to $0.000006231. Futures inflows higher; volumes surged. Technicals show 50-day MA support, RSI 55, MACD bullish; potential move beyond 0.000010.
Abstract: This report reviews SHIB market activity on Gate News as of April 22. SHIB open interest rose 13.45% to $69.79 million, with the price up about 3% to $0.000006231. Futures inflows exceeded outflows and total volumes rose, while spot and futures taker data showed mixed biases. Technically SHIB found support near the 50-day MA, RSI sits at 55, and the MACD turned positive, signaling a potential breakout and a possible rally beyond the $0.000010 level after a confirmed channel breakout.
GateNews5u geleden