
Date: Sat, Dec 27, 2025 | 06:45 AM GMT
Hyperliquid (HYPE), the native token of the fast-growing decentralized exchange, has been under pressure over the past month, sliding nearly 27% amid broader weakness across the altcoin market. However, recent price action suggests that bearish momentum may be easing. HYPE has turned green today with modest gains, but more importantly, its technical structure is flashing early signs of a potential bullish continuation.
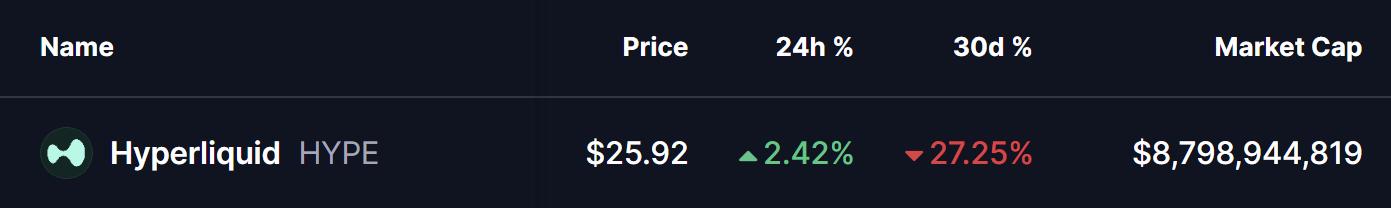
Source: Coinmarketcap
After weeks of consolidation, the token appears to be transitioning from a corrective phase into a possible expansion move, supported by improving market sentiment and a clear breakout on lower timeframes.
Ascending Triangle Breakout
On the 4-hour chart, HYPE had been trading within a well-defined ascending triangle pattern — a bullish structure characterized by higher lows pressing against a flat resistance level. Throughout this consolidation phase, sellers repeatedly defended the $25.66 region, while buyers continued to step in at progressively higher prices, tightening the price range.
That standoff has now resolved to the upside. Bulls successfully pushed HYPE above the $25.66 resistance, triggering a confirmed breakout and driving price toward a local high near $26.43. This move marks a clear shift in short-term momentum and suggests growing confidence among buyers after an extended period of uncertainty.
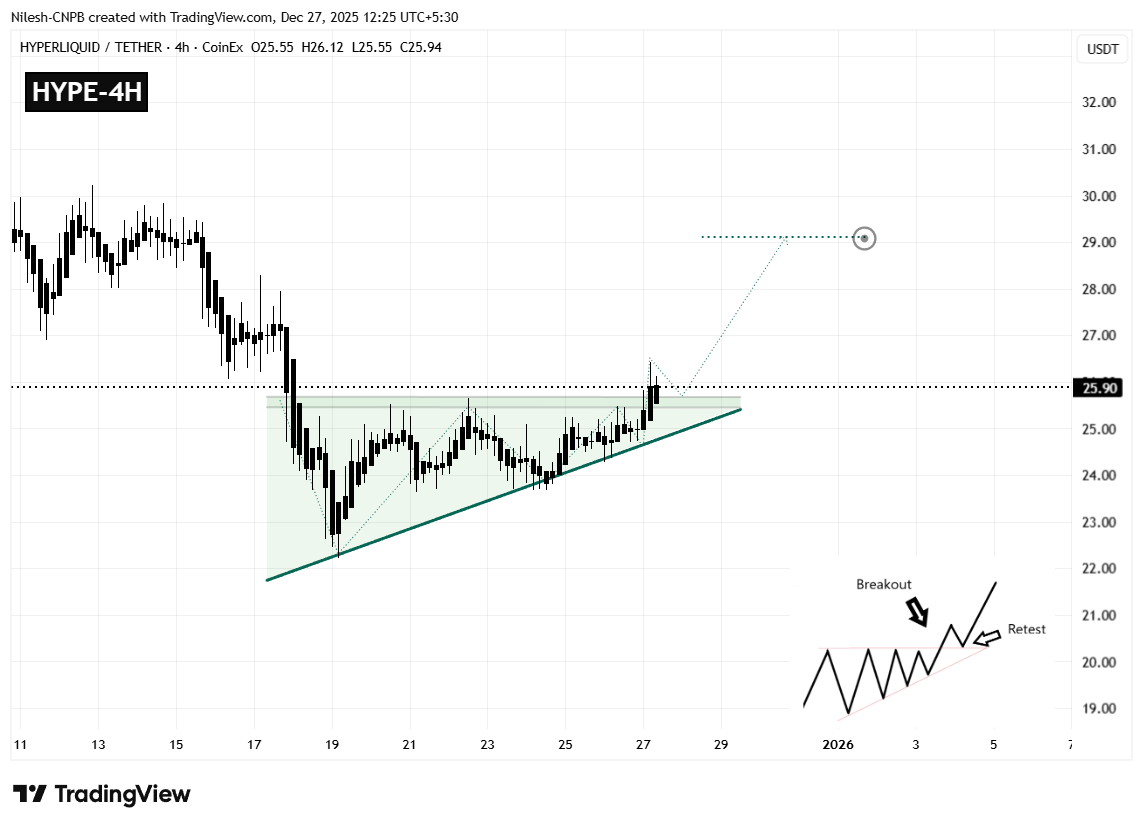
Hyperliquid (HYPE) 4H Chart/Coinsprobe (Source: Tradingview)
The breakout also aligns with the rising trendline support that has guided price higher since the recent swing low, further strengthening the bullish case.
What’s Next for HYPE?
Following a breakout of this nature, a brief pause or pullback is often healthy. In HYPE’s case, the $25.48–$25.66 zone now becomes a key area to watch. A controlled retest of this region — followed by a strong reaction higher — would confirm the former resistance as new support and reinforce the bullish structure.
If that scenario plays out, the chart points toward a potential upside move toward the $29.10 region. This target represents roughly a 12% upside from current levels and aligns with the projected measured move of the ascending triangle.
On the downside, failure to hold above the breakout zone could weaken the bullish outlook. A drop back below the former resistance or a loss of trendline support may expose HYPE to renewed selling pressure, potentially leading to a deeper consolidation before any fresh attempt higher.
For now, the breakout remains intact, and as long as buyers defend the newly reclaimed levels, HYPE appears positioned for a continued recovery move in the sessions ahead.
Disclaimer: The views and analysis presented in this article are for informational purposes only and reflect the author’s perspective, not financial advice. Technical patterns and indicators discussed are subject to market volatility and may or may not yield the anticipated results. Investors are advised to exercise caution, conduct independent research, and make decisions aligned with their individual risk tolerance.
Disclaimer: The information on this page may come from third parties and does not represent the views or opinions of Gate. The content displayed on this page is for reference only and does not constitute any financial, investment, or legal advice. Gate does not guarantee the accuracy or completeness of the information and shall not be liable for any losses arising from the use of this information. Virtual asset investments carry high risks and are subject to significant price volatility. You may lose all of your invested principal. Please fully understand the relevant risks and make prudent decisions based on your own financial situation and risk tolerance. For details, please refer to
Disclaimer.
Related Articles
Bitcoin’s implied volatility drops to an intra-year low, and the market is reacting mildly to Friday’s CPI data
April 9, U.S. March CPI data will be released on April 11. The market expects the year-over-year rate to rise from 2.4% to 3.4%. The Bitcoin market has responded calmly, with the options market’s volatility range only at 2.5%. Attention has been drawn by the rise in gasoline prices. Analysts believe that CPI data coming in either too soft or too hot will have different impacts on the crypto market.
GateNews1h ago
XRP Stabilizes Near Key Levels Amid Fed Pressure and Rule Shift
Key Insights
XRP stabilized near $1.31 as macroeconomic pressures and declining liquidity combined to limit recovery momentum and increase short-term volatility risks significantly.
Proposed stablecoin regulations favor utility models, positioning RLUSD for growth while reducing incentives t
CryptoNewsLand1h ago
XRP Today’s News: Institutional funds return, circulating inflow of 120 million exceeds Bitcoin
This week, XRP recorded a $119.6 million capital inflow, setting the highest mark since 2025 and becoming a major beneficiary in the crypto market. This round of funds returning was mainly driven by greater clarity in regulatory policy and XRP’s real-world use in cross-border payment infrastructure. Technically, it shows an initial recovery, but overall it is still in a downward channel. The support and resistance levels are $1.31 and $1.40, respectively; if it breaks through, it is expected to reach $1.50.
MarketWhisper3h ago
XRP drops to $1.33, with $3.32 million in ETF inflows still failing to reverse the downtrend; the key support to watch is $1.28
In April 2026, the XRP price pulled back to $1.33, down about 4%. Although there was capital inflow into Ripple-related products, selling pressure dominated the market, and increased trading volume signaled distribution. Declining liquidity further heightens volatility risk; watch the $1.33 support—if it breaks, prices will likely fall further. For a short-term rebound, it needs to break above $1.35; otherwise, it should remain in a weak range-bound consolidation.
GateNews3h ago
XRP Price Structure Signals More Downside — Key Levels to Watch
XRP fails to make new highs, confirming bearish market structure remains intact.
Price targets $1.13, $1.08, and potentially $0.87 support levels.
Traders should wait for confirmation instead of reacting to short-term price moves.
Short bursts of green candles can quickly shift market
CryptoNewsLand4h ago
Bitcoin is hovering around the $700,000 level; if oil prices fall below $100 or push toward $80,000
Bitcoin has recently been trading in a high-level range. The price rebounded from $67,000 to $70,900, driven by a U.S.-Iran ceasefire agreement. Market analysis suggests that weakness in oil prices—or easing inflation pressure—may support Bitcoin’s upside. If it breaks above $72,500, it could trigger short liquidations and push the price up to $80,000. However, instability in the Middle East and a rebound in oil prices could act as a drag. Volatility in the energy market will be a key factor influencing Bitcoin’s direction.
GateNews4h ago
