
Date: Tue, Dec 30, 2025 | 01:45 PM GMT
The broader cryptocurrency market is showing modest strength, with both Bitcoin (BTC) and Ethereum (ETH) trading in the green. This steady performance among major assets has helped stabilize overall market sentiment, allowing select altcoins — including **Canton (CC) **— to develop constructive technical setups.
CC is standing out with an impressive 13% daily gain. More importantly, price action confirms a technically significant breakout, strengthening the case for further upside in the near term.
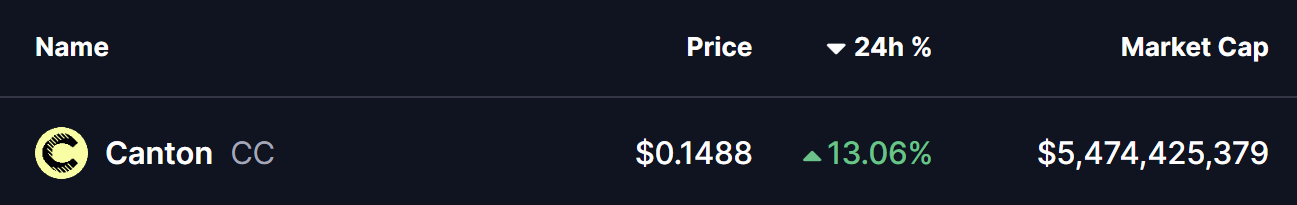
Source: Coinmarketcap
Rounding Bottom Breakout
On the daily chart, CC has confirmed a breakout from a classic rounding bottom pattern, a bullish reversal structure that typically signals a transition from accumulation to trend continuation.
This formation began taking shape in early November after price was rejected near the $0.1360 resistance level. That rejection triggered a prolonged decline, with CC eventually bottoming around $0.0586. From there, selling pressure gradually faded as buyers stepped in at higher levels, carving out a smooth, rounded base over several weeks.
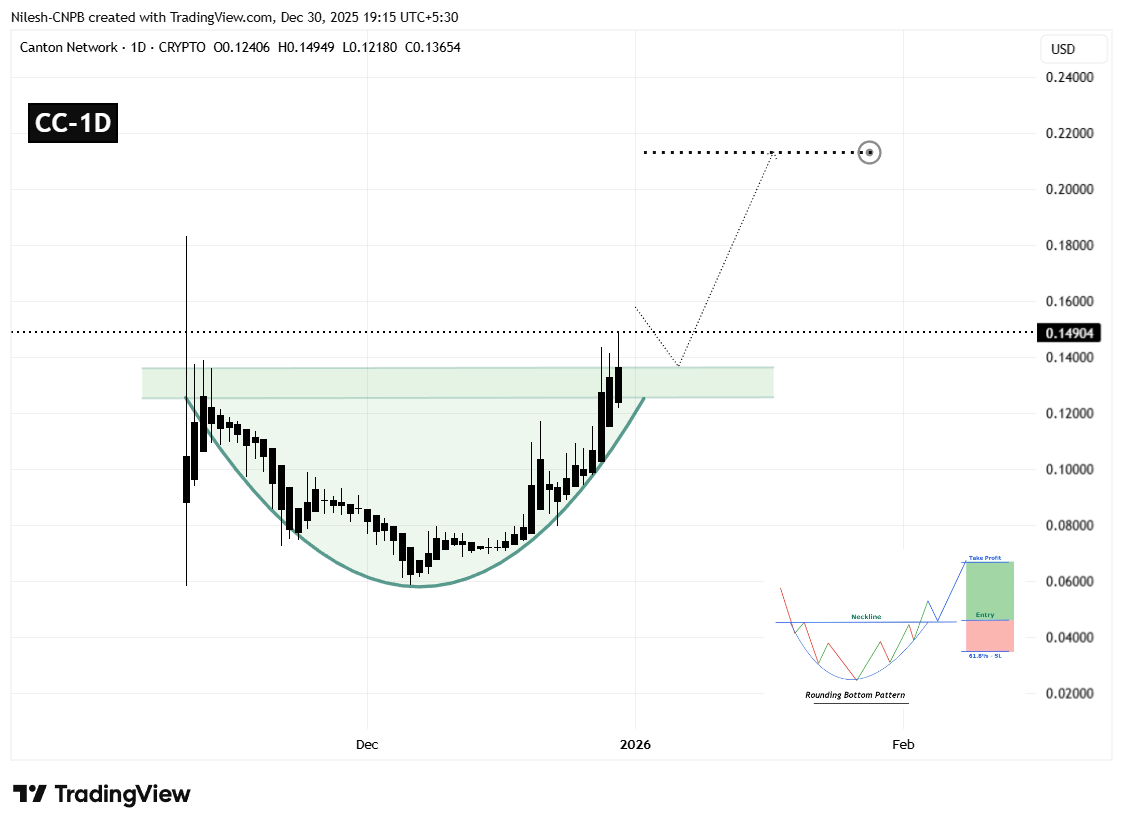
Canton (CC) Daily Chart/Coinsprobe (Source: Tradingview)
The structure completed once CC pushed decisively back above the $0.1360 neckline, confirming the breakout. This move marked a clear shift in market control from sellers to buyers, supported by expanding candles and improving momentum.
Price is now trading at $0.1490 comfortably above the breakout zone, signaling that bullish participants remain active and that the breakout has so far held without immediate rejection.
What’s Next for CC?
Following a breakout of this nature, a brief pullback toward the former resistance is often healthy. For CC, the $0.1250–$0.1360 region now acts as a critical support zone. A controlled retest of this area, followed by renewed buying interest, would further validate the bullish structure and reinforce confidence in continuation.
If this support holds, the rounding bottom’s measured move projects a potential upside target near the $0.2130 region. This represents roughly a 40%–45% advance from the breakout zone and aligns with the projected extension visible on the chart.
On the downside, failure to hold above the neckline could slow momentum and trigger a period of consolidation. A sustained drop back below the breakout level would weaken the bullish outlook and delay any upside continuation. However, as long as CC remains above reclaimed support, the technical structure favors higher prices in the sessions ahead.
For now, the breakout remains intact, and CC appears well-positioned to extend its recovery move if broader market conditions remain supportive.
Disclaimer: The views and analysis presented in this article are for informational purposes only and reflect the author’s perspective, not financial advice. Technical patterns and indicators discussed are subject to market volatility and may or may not yield the anticipated results. Investors are advised to exercise caution, conduct independent research, and make decisions aligned with their individual risk tolerance.
About Author: Nilesh Hembade is the Founder and Lead Author of Coinsprobe, with over 5 years of experience in the cryptocurrency and blockchain industry. Since launching Coinsprobe in 2023, he has been providing daily, research-driven insights through in-depth market analysis, on-chain data, and technical research.

Disclaimer: The information on this page may come from third parties and does not represent the views or opinions of Gate. The content displayed on this page is for reference only and does not constitute any financial, investment, or legal advice. Gate does not guarantee the accuracy or completeness of the information and shall not be liable for any losses arising from the use of this information. Virtual asset investments carry high risks and are subject to significant price volatility. You may lose all of your invested principal. Please fully understand the relevant risks and make prudent decisions based on your own financial situation and risk tolerance. For details, please refer to
Disclaimer.
Related Articles
Bitcoin’s implied volatility drops to an intra-year low, and the market is reacting mildly to Friday’s CPI data
April 9, U.S. March CPI data will be released on April 11. The market expects the year-over-year rate to rise from 2.4% to 3.4%. The Bitcoin market has responded calmly, with the options market’s volatility range only at 2.5%. Attention has been drawn by the rise in gasoline prices. Analysts believe that CPI data coming in either too soft or too hot will have different impacts on the crypto market.
GateNews54m ago
XRP Stabilizes Near Key Levels Amid Fed Pressure and Rule Shift
Key Insights
XRP stabilized near $1.31 as macroeconomic pressures and declining liquidity combined to limit recovery momentum and increase short-term volatility risks significantly.
Proposed stablecoin regulations favor utility models, positioning RLUSD for growth while reducing incentives t
CryptoNewsLand54m ago
XRP Today’s News: Institutional funds return, circulating inflow of 120 million exceeds Bitcoin
This week, XRP recorded a $119.6 million capital inflow, setting the highest mark since 2025 and becoming a major beneficiary in the crypto market. This round of funds returning was mainly driven by greater clarity in regulatory policy and XRP’s real-world use in cross-border payment infrastructure. Technically, it shows an initial recovery, but overall it is still in a downward channel. The support and resistance levels are $1.31 and $1.40, respectively; if it breaks through, it is expected to reach $1.50.
MarketWhisper3h ago
XRP drops to $1.33, with $3.32 million in ETF inflows still failing to reverse the downtrend; the key support to watch is $1.28
In April 2026, the XRP price pulled back to $1.33, down about 4%. Although there was capital inflow into Ripple-related products, selling pressure dominated the market, and increased trading volume signaled distribution. Declining liquidity further heightens volatility risk; watch the $1.33 support—if it breaks, prices will likely fall further. For a short-term rebound, it needs to break above $1.35; otherwise, it should remain in a weak range-bound consolidation.
GateNews3h ago
XRP Price Structure Signals More Downside — Key Levels to Watch
XRP fails to make new highs, confirming bearish market structure remains intact.
Price targets $1.13, $1.08, and potentially $0.87 support levels.
Traders should wait for confirmation instead of reacting to short-term price moves.
Short bursts of green candles can quickly shift market
CryptoNewsLand3h ago
Bitcoin is hovering around the $700,000 level; if oil prices fall below $100 or push toward $80,000
Bitcoin has recently been trading in a high-level range. The price rebounded from $67,000 to $70,900, driven by a U.S.-Iran ceasefire agreement. Market analysis suggests that weakness in oil prices—or easing inflation pressure—may support Bitcoin’s upside. If it breaks above $72,500, it could trigger short liquidations and push the price up to $80,000. However, instability in the Middle East and a rebound in oil prices could act as a drag. Volatility in the energy market will be a key factor influencing Bitcoin’s direction.
GateNews3h ago
