
**Date: **Mon, Jan 05, 2026 | 05:26 AM GMT
As 2026 kicks off, the broader cryptocurrency market is showing renewed stability. Ethereum (ETH) is up nearly 4% on the week, and momentum is gradually spreading across major altcoins — including the decentralized exchange token Aster (ASTER).
While ASTER is also posting over 4% weekly gains, the more important story is unfolding beneath the surface. Recent price action suggests a meaningful structural shift may be developing — one that could mark the early stages of a bullish continuation if key technical levels are reclaimed.
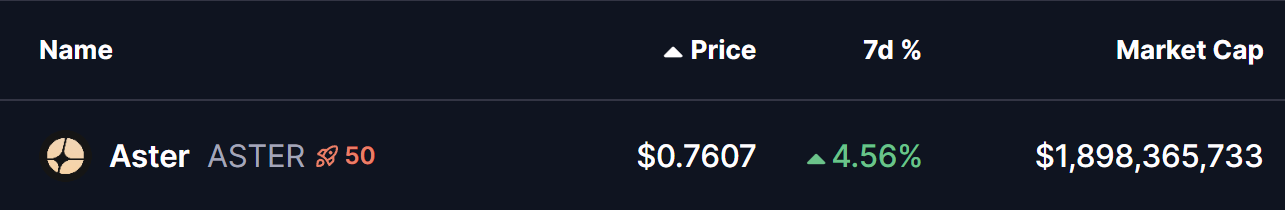
Source: Coinmarketcap
Rounding Bottom in Play
On the daily timeframe, **Aster **appears to be forming a rounding bottom pattern, a classic bullish reversal structure that typically develops after a prolonged corrective phase. This pattern reflects a gradual transition from aggressive selling to steady accumulation, as downside momentum fades and buyers slowly regain confidence.
The setup began after ASTER faced strong rejection near the $1.35–$1.40 neckline resistance zone, triggering a sharp decline through late November and December. That downside move eventually found strong demand near the $0.6546 support level, which has since acted as a critical base. Multiple defenses of this zone prevented further downside and helped establish a stable foundation for a potential trend reversal.
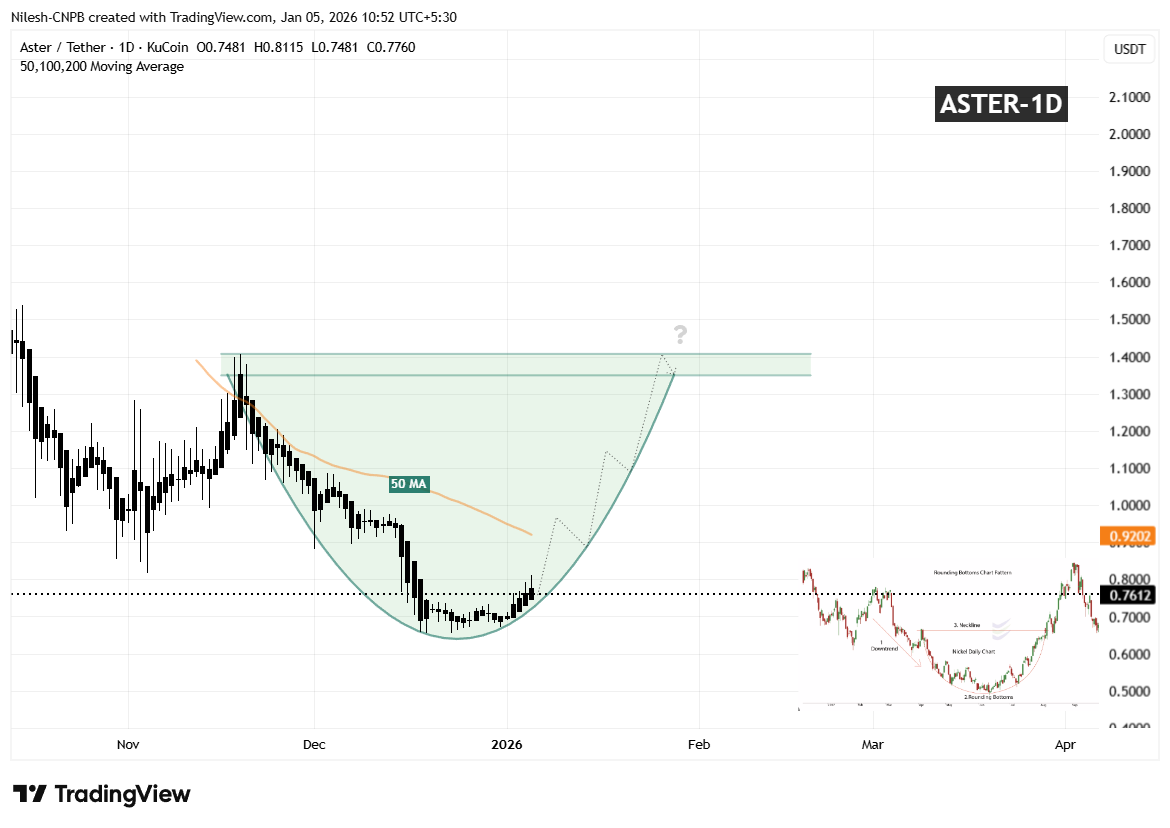
Aster (ASTER) Daily Chart/Coinsprobe (Source: Tradingview)
Since carving out that bottom, ASTER has started to curve higher in a smooth, rounded fashion — closely matching the textbook structure of a developing rounding bottom. The recent stabilization above the $0.76 region further supports the view that selling pressure is weakening and accumulation may be underway.
A key technical level now comes into focus: the 50-day moving average, currently hovering near $0.9202. This moving average has acted as dynamic resistance throughout the recovery phase, repeatedly capping upside attempts.
What’s Next for ASTER?
For the rounding bottom structure to gain confirmation, ASTER needs to reclaim the $0.9202 region and establish acceptance above the 50-day moving average. A sustained move above this zone would signal that buyers are regaining control after months of corrective price action.
Beyond that, the most significant technical barrier remains the $1.35–$1.40 neckline resistance. A clean and decisive breakout above this area would validate the entire reversal pattern and could open the door for a broader bullish expansion phase, with momentum traders and sidelined participants likely re-entering the market.
Until those levels are reclaimed, the pattern remains in development. Short-term consolidation or minor pullbacks remain possible if ASTER struggles near the 50-day MA. However, as long as price continues to form higher lows and holds above the established rounding base, the broader bottoming structure remains intact and constructive.
Disclaimer: The views and analysis presented in this article are for informational purposes only and reflect the author’s perspective, not financial advice. Technical patterns and indicators discussed are subject to market volatility and may or may not yield the anticipated results. Investors are advised to exercise caution, conduct independent research, and make decisions aligned with their individual risk tolerance.
About Author: Nilesh Hembade is the Founder and Lead Author of Coinsprobe, with over 5 years of experience in the cryptocurrency and blockchain industry. Since launching Coinsprobe in 2023, he has been providing daily, research-driven insights through in-depth market analysis, on-chain data, and technical research.
Disclaimer: The information on this page may come from third parties and does not represent the views or opinions of Gate. The content displayed on this page is for reference only and does not constitute any financial, investment, or legal advice. Gate does not guarantee the accuracy or completeness of the information and shall not be liable for any losses arising from the use of this information. Virtual asset investments carry high risks and are subject to significant price volatility. You may lose all of your invested principal. Please fully understand the relevant risks and make prudent decisions based on your own financial situation and risk tolerance. For details, please refer to
Disclaimer.
Related Articles
BTC 15-minute rise 0.48%: stronger spot buy-side demand combined with shrinking liquidity driving the move
2026-04-13 14:30 to 2026-04-13 14:45 (UTC), BTC saw a +0.48% return within a 0.55% amplitude range (71600.7–71997.0 USDT). During this period, market volatility increased; both spot and on-chain data indicate that short-term capital flows were notably active, market attention rose, and sentiment remains cautious.
The main driver behind this deviation is stronger spot-market buy pressure and the continued net outflow of exchange funds. Specifically, over the past 24 hours, BTC spot trading volume was about $33.15B, compared with the 7-day average
GateNews1h ago
Bitmine gets promoted to the NYSE main board! Tom Lee: US stocks may be at their bottom, and selling pressure on Ether could ease
Bitmine has officially transferred from the NYSE American board to the main board in the United States, marking an important milestone for the company. Despite a significant drop in its share price, it has still increased the share repurchase plan amount to $4.0 billion. The company holds a large amount of Ether, and it expects that a rebound in the crypto market will help improve its assets and share price performance.
CryptoCity1h ago
Gold and silver fall across the board, and the BTC/ETH volatility index rises slightly
On April 13, gold and silver prices fell to $4,732.92 per ounce and $74.209 per ounce, respectively. The BTC volatility index rose by 0.42%, and the ETH volatility index rose by 0.31%. The U.S. dollar versus the Chinese yuan and the Japanese yen edged up slightly, major European stock indexes generally fell, while WTI and Brent crude oil prices rose. The Gate platform supports trading for multiple asset types.
GateNews1h ago
ETH 15-minute rise of 1.24%: On-chain capital outflows and macro risk aversion converge to boost volatility
From 2026-04-13 13:45 to 14:00 (UTC), ETH surged rapidly within a 1.48% amplitude. The price ranged from 2182.61 to 2214.98 USDT, and the return rate in 15 minutes reached +1.24%. This bout of unusual activity has drawn market attention, with active capital inflows and outflows, a marked increase in volatility, and a short-term warming of trading sentiment.
The main driver behind this unusual activity is on-chain capital outflows and changes in the holdings structure. Over the past few weeks, the net positions of the 1k–10k ETH whale cohort and the 10k+ super whale cohort have continued to decline, around April 13, the related
GateNews1h ago
Bitcoin retreats to $71k, spot ETF net inflows of nearly $1 billion last week
Bitcoin and Ethereum prices were holding steady around April 13, and the overall crypto market weakened. Oil prices rebounded, influenced by the situation in the Middle East. Bitcoin ETF funds worth nearly $1 billion flowed in, but addresses still in unrealized losses remain in the majority, and open interest in futures contracts fell significantly.
GateNews2h ago
Bitcoin’s Bearish Breakdown Signifies Collapse of Futures-Led Rally
Bitcoin is experiencing significant volatility following a futures-driven market rally that has collapsed, leading to major price corrections and a drop in Open Interest. The market is now vulnerable to further downturns due to a lack of spot demand, indicating structural weaknesses.
BlockChainReporter2h ago
