Hedera (HBAR) is currently fluctuating around the 0.127 USD level during Wednesday’s trading session, approaching a key resistance zone. If the price convincingly breaks through this level, the market could witness a new upward momentum in the near future. Notably, demand from institutional investors continues to increase, as spot HBAR ETF funds have recorded three consecutive days of net inflows this week. Simultaneously, positive signals from on-chain data and derivatives markets further reinforce the expectation that HBAR is on the verge of extending its bullish trend.
Institutional demand for HBAR continues to grow
Demand from institutional investors for Hedera has shown a clear increase this week. According to data from SoSoValue, spot Hedera ETF funds attracted $817,770 in capital on Tuesday, marking the third consecutive day of positive inflows since last week. This development reflects strong investor confidence and opens up the possibility that if capital inflows continue and increase, HBAR could extend its current upward trend.
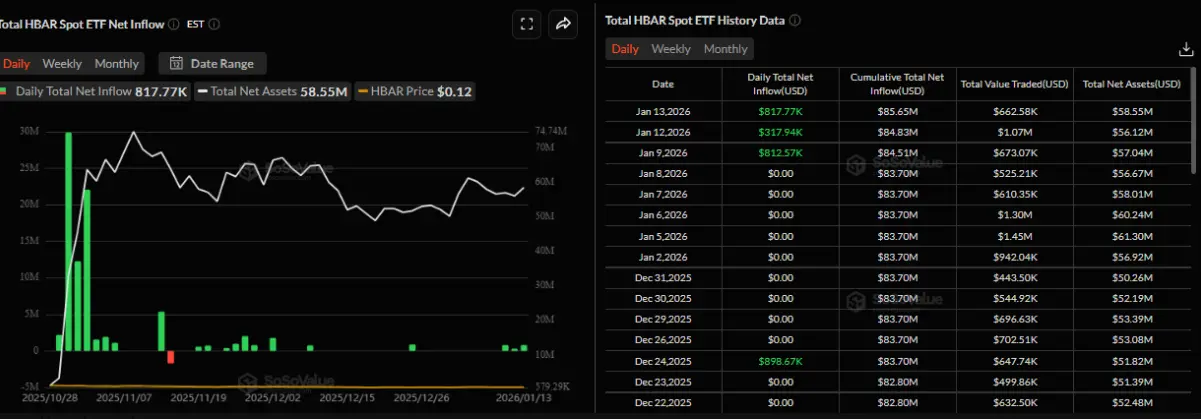 Total net inflow chart into HBAR spot ETFs## Positive on-chain and derivatives indicators
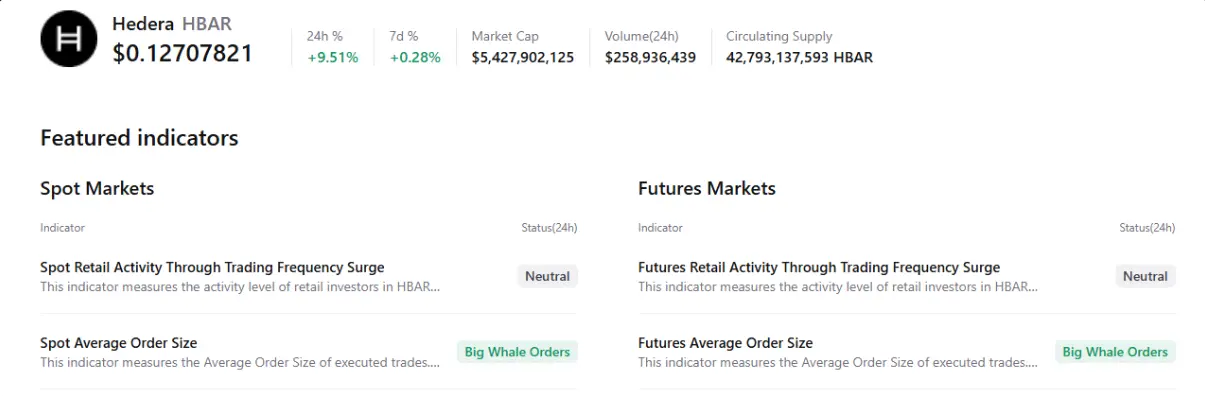
Data from the CryptoQuant chart below further strengthen HBAR’s positive outlook, as both the spot market and futures contracts show large buy orders from whales. This movement is often seen as an early signal that a new bullish phase may be forming in the near future.
In the derivatives market, bullish sentiment is also becoming more evident. According to Coinglass, the long/short ratio of HBAR reached 1.06 on Wednesday — the highest in over a month. Maintaining this ratio above 1 indicates that most traders are leaning towards a bullish scenario, reflecting growing confidence in Hedera’s continued upward movement.
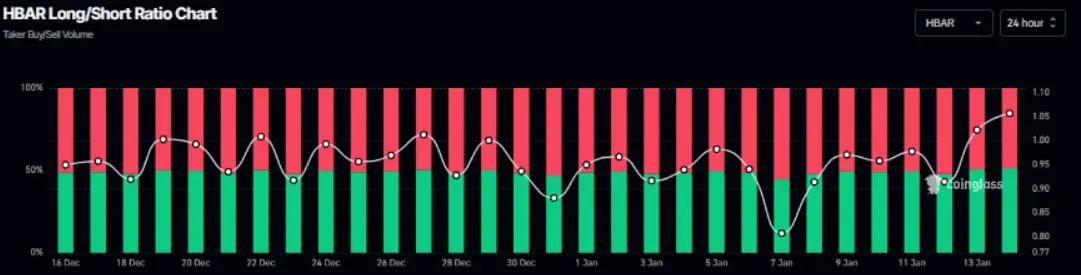 Hedera long/short ratio chart | Source: Coinglass## Hedera Price Forecast: HBAR could extend its rally if it closes above the 50-day EMA
Hedera (HBAR) is currently moving within a descending wedge pattern formed since late July, with highs and lows gradually narrowing. Notably, HBAR surged over 6% during Tuesday’s trading session, indicating renewed buying interest. As of Wednesday, the price is approaching the 50-day exponential moving average (EMA) around the 0.127 USD mark — an important technical level.
In a positive scenario, if HBAR can close firmly above the 50-day EMA, the recovery momentum is likely to continue, pushing the price toward the upper trendline of the wedge pattern, around 0.152 USD.
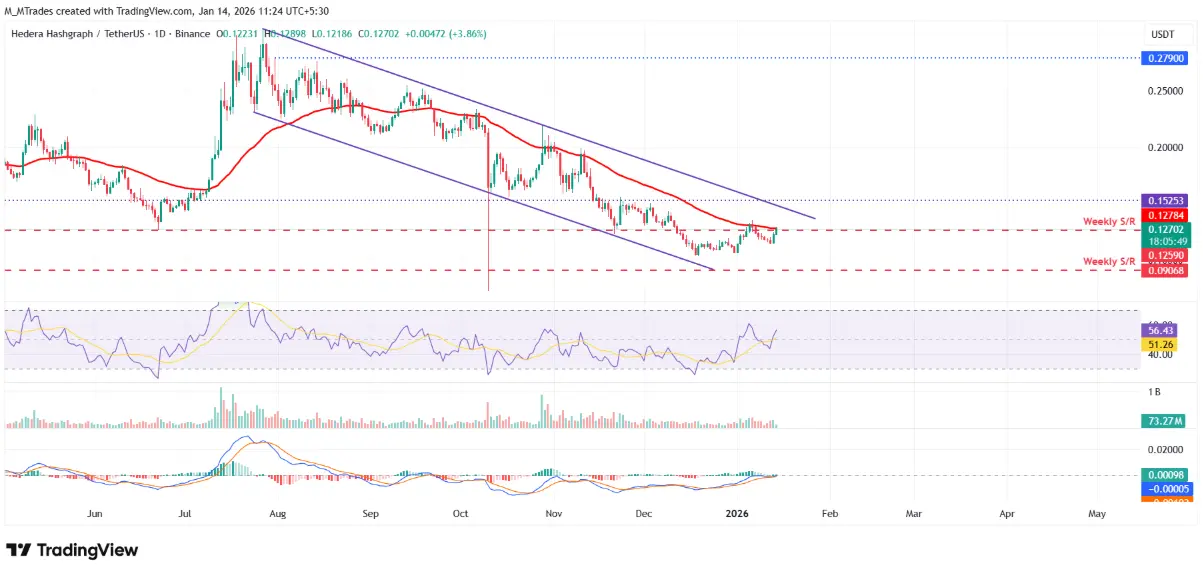 Daily HBAR/USDT chart | Source: TradingView Technical indicators also support a bullish outlook. The daily RSI stands at 56, rising above the neutral 50 level, indicating increasing buying momentum. Meanwhile, the MACD continues to show a bullish crossover, further strengthening the optimistic scenario.
However, the risk of a correction should not be overlooked. If selling pressure increases, HBAR could reverse and decline toward the weekly support zone around 0.090 USD, where demand is expected to re-emerge.
SN_Nour
Disclaimer: The information on this page may come from third parties and does not represent the views or opinions of Gate. The content displayed on this page is for reference only and does not constitute any financial, investment, or legal advice. Gate does not guarantee the accuracy or completeness of the information and shall not be liable for any losses arising from the use of this information. Virtual asset investments carry high risks and are subject to significant price volatility. You may lose all of your invested principal. Please fully understand the relevant risks and make prudent decisions based on your own financial situation and risk tolerance. For details, please refer to
Disclaimer.
Related Articles
Chainlink Sees 25% Whale Growth: Will LINK Push Toward $27?
Chainlink whales grew 25% in a year, signaling strong accumulation by large holders.
Institutional adoption and reserve growth tighten LINK supply, supporting potential upward price movement.
LINK trades in a narrow range; a breakout could push toward $27.
Chainlink — LINK, has been
CryptoNewsLand14m ago
Hyperliquid Faces Volatility as Whales Shift Positions: Will HYPE Hold $35?
Whale activity drives HYPE volatility, creating uncertainty around short-term price movements.
Accumulation trends remain strong, with investors moving $11.7 million HYPE off exchanges.
Key support at $33.48–$35.19 may determine whether HYPE rebounds or drops further.
Hyperliquid — HYPE,
CryptoNewsLand1h ago
BTC profit/loss trade ratio is 2.95, the highest level in 12 weeks
Gate News message: On April 6, according to Santiment data, the BTC profit-loss trade ratio reached 2.95, the highest level in 12 weeks. This indicator measures the ratio of profitable trades to losing trades; the current value shows that the share of profitable trades in the market is significantly higher than that of losing trades, reaching a recent peak level.
GateNews1h ago
SHIB Climbs 1.45% as Golden Cross Signals Potential Breakout
Price rises 1.45% as golden cross signals possible bullish momentum.
Spot inflows surge, indicating some holders may lock in profits.
Open interest rises cautiously, showing traders hesitant to commit strongly.
Shiba Inu has attracted attention after climbing 1.45% over the past 24
CryptoNewsLand2h ago
The RWA Yield Infrastructure Trade
The essay highlights challenges in direct RWA token exposure, emphasizes the potential in leverage opportunities amid settlement delays, critiques Morpho's governance token structure, and presents Fluid as a more effective token model with stablecoin links.
CoinDesk2h ago
BTC 15-minute pullback of 0.66%: Trade policy shock combined with large holders selling off triggers downside pressure
From 06:15 to 06:30 (UTC) on 2026-04-06, the BTC price dropped from 68807.2 to 69308.1 USDT; the 15-minute return recorded -0.66%, and the amplitude reached 0.72%. During this period, market volatility intensified, with trading volume and social discussion heat increasing in tandem, reflecting intense short-term capital games.
The main driving force behind this abnormal movement came from sudden changes at the macro policy level. The United States has recently increased tariffs and continued its high-tariff policy, causing a sharp drop in global risk appetite and prompting investors to withdraw en masse from high-volatility assets. Related con
GateNews2h ago
