Key Notes
- Avalanche recently recorded a new peak for daily active addresses.
- The network became 43 times more cost-efficient over the past year.
- AVAX fell sharply on Jan.
- 19 during a wider crypto market drop.
Avalanche
AVAX
$12.79
24h volatility:
6.2%
Market cap:
$5.51 B
Vol. 24h:
$410.27 M
has recently seen a sharp spike in network use. On Jan. 19, daily active addresses on Avalanche C Chain reached 1.71 million, the highest level ever recorded. Before this, daily addresses stayed mostly around 300,000-600,000.
The move points to renewed use across apps, transfers, and on-chain actions. Over the past year, Avalanche has become 43 times more cost-efficient.
Related article: Ethereum User Retention Doubles, Daily Transactions Hit Record 2.8MIn 2025, daily transactions increased 153.6% year over year to an average of 4.2 million. Daily active addresses climbed 379.6% year over year to 380,000. Total transactions reached 1.45 billion, up 152.9% from 2024.
Avalanche continues to post fast finality of about two seconds, low fees, and throughput above 4,500 transactions per second.
AVX Price Drops Despite Network Strength
Despite the growing on-chain activity, the Avalanche token (AVAX) continues to struggle. On Jan. 19, AVAX saw a major price drop amid a broader crypto market downturn. At the time of writing, AVAX is trading around $12.59, down by 7.5% over the past day.
Notably, AVAX has been trending lower after surging above $35 in September last year. Since then, the token’s market cap has fallen by about $9.44 billion and currently sits near $5.43 billion. AVAX is now ranked 20th by market cap.
Sharp Move Ahead?
Momentum readings show AVAX at its weakest level since the 2022-2023 bear market low. Historically, such periods lead to late-stage sell pressure and a potential sharp move if risk conditions turn.
On the daily chart, AVAX is trading below the mid Bollinger Band (20-day SMA). Price recently tagged the lower band near $12, a zone where short-term selling pressure surges. If the token fails to hold $12, it could risk a drop toward $10.50.
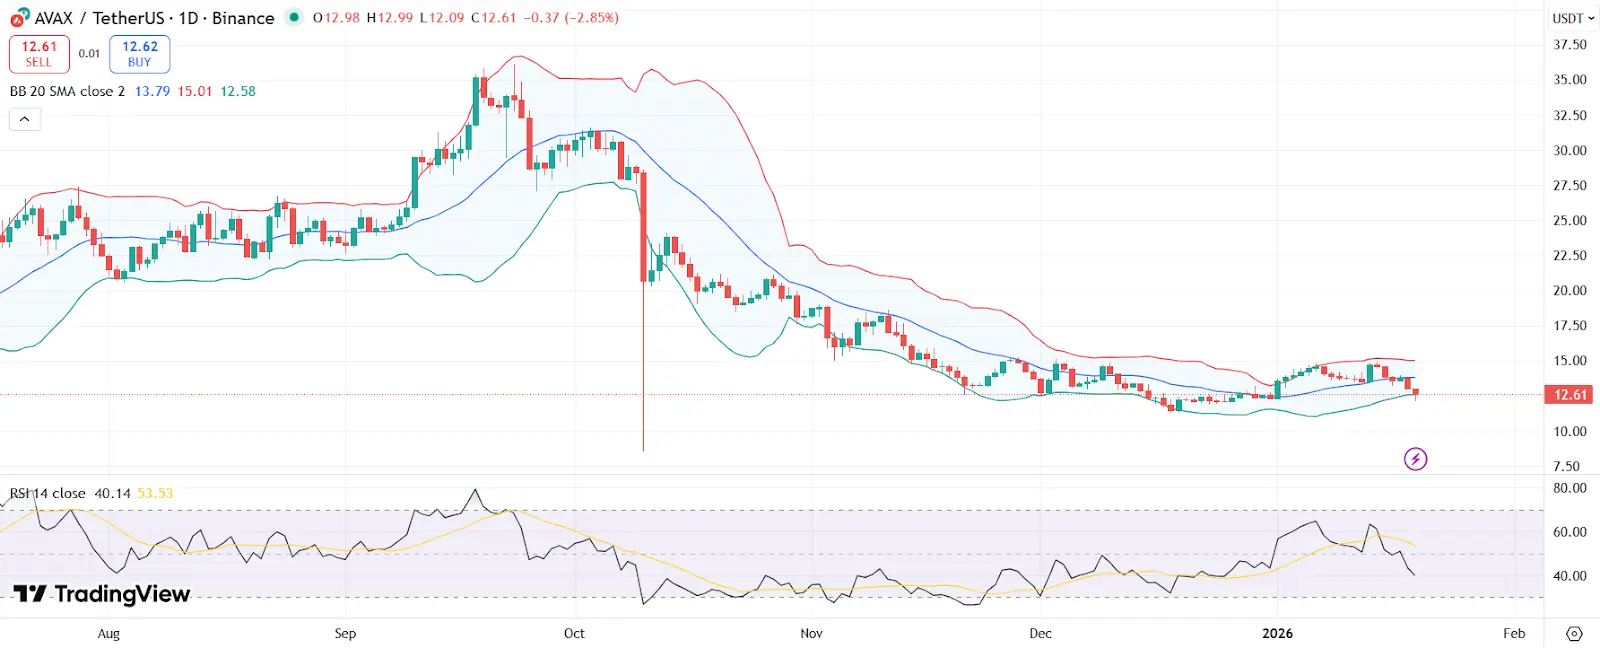 AVAX price chart with RSI and Bollinger Bands | Source: TradingView
Meanwhile, RSI is below neutral but not yet extreme. A price increase above $13.80 could lead the token to the upper Bollinger Band around $15. If AVAX manages to close above $16, it would confirm a trend reversal and potential price rally.
nextDisclaimer: Coinspeaker is committed to providing unbiased and transparent reporting. This article aims to deliver accurate and timely information but should not be taken as financial or investment advice. Since market conditions can change rapidly, we encourage you to verify information on your own and consult with a professional before making any decisions based on this content.
Disclaimer: The information on this page may come from third parties and does not represent the views or opinions of Gate. The content displayed on this page is for reference only and does not constitute any financial, investment, or legal advice. Gate does not guarantee the accuracy or completeness of the information and shall not be liable for any losses arising from the use of this information. Virtual asset investments carry high risks and are subject to significant price volatility. You may lose all of your invested principal. Please fully understand the relevant risks and make prudent decisions based on your own financial situation and risk tolerance. For details, please refer to
Disclaimer.
Related Articles
XRP Rises 4% as Ripple Partnership and ETF Inflows Drive Recovery
XRP rose 4% to $1.41, boosted by Ripple's partnership with Kyobo Life and increasing institutional interest. Broader market gains and positive community engagement also contributed, though XRP remains 63% below its peak. Key support is at $1.38.
GateNews13m ago
ETH/BTC ratio rebounds—are institutional funds rotating? A deep dive into structural signals in the crypto market
BTC breaks through $75,000; the Iran–Israel ceasefire and fresh highs in U.S. stocks lift risk assets, but the options market remains somewhat cautious. The ETH/BTC ratio rebounds, signaling capital rotation.
GateInstantTrends1h ago
Crypto Market Rebounds 1.5% to $2.54T as Bitcoin Leads Rally Amid Tech Surge and Policy Progress
The crypto market rebounded 1.5% to $2.54 trillion, led by Bitcoin's 7% gain amid easing geopolitical tensions and strong ETF inflows. Analysts predict further gains if Bitcoin surpasses $76K resistance.
GateNews1h ago
Bitcoin bull market index rises to 40 points; Bloomberg: the U.S. and Iran are considering extending the ceasefire agreement by two weeks
Bitcoin’s price as of April 16 is approaching $74,700. The Bullish Sentiment Index (BSI) has risen to 40 points, indicating a rebound in market sentiment. The United States and Iran are evaluating options to extend the current ceasefire agreement, and they are also discussing navigation issues in the Strait of Hormuz, as diplomatic negotiations continue.
MarketWhisper7h ago
Bitcoin holds steady at 74K, and FOMO sentiment is heating up as U.S. stocks hit a record high
Benefiting from positive news about the U.S.-Iran peace agreement, the stock market surged sharply, with the Nasdaq index and the S&P 500 index reaching record highs. Bitcoin remained steady at 74K, market sentiment improved, and the Fear & Greed Index rose to 55. Investor FOMO toward the stock market intensified, and the total market capitalization in the crypto market increased overall, indicating genuine buy-side interest.
ChainNewsAbmedia8h ago
