
Key Takeaways
-
OriginTrail (TRAC) has surged around 12% in a single day, drawing renewed attention to the token.
-
TRAC has broken out from an ascending triangle near $0.46 on the daily chart, signaling growing bullish momentum.
-
Similar breakout structures in July and October 2025 previously led to strong rallies of 63% and 113%.
-
Holding the $0.44–$0.46 zone as support will be crucial to keep the bullish fractal setup intact.
-
If the pattern plays out, TRAC could attempt a move toward its long-term ascending resistance above $1.00.
OriginTrail, the decentralized knowledge graph protocol, is stepping back into the spotlight as its native token TRAC records a strong 12% daily surge. Beyond the price jump, the real signal is coming from the charts, where a familiar fractal breakout structure is starting to emerge on the daily timeframe, hinting that a larger upside move could be forming.
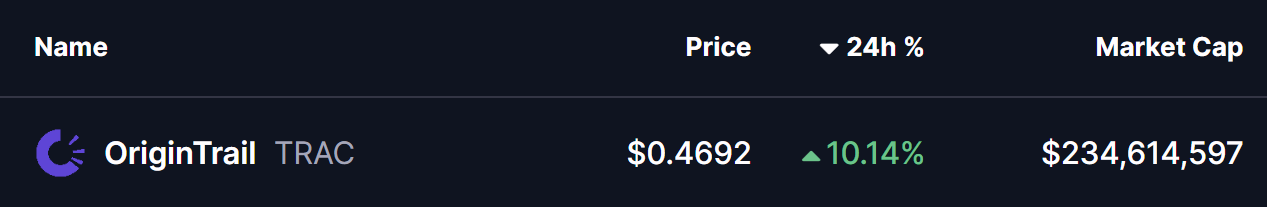
Source: Coinmarketcap
Fractal Breakout Hints at Potential Upside Move
On the daily chart, TRAC has confirmed a breakout from an ascending triangle pattern near the $0.46 level. This breakout is particularly important as price is now trading just above the 200-day moving average, a level that has historically acted as a major trend-defining zone for TRAC.
What makes this setup more compelling is its similarity to previous breakout phases. In late July 2025, a comparable structure resulted in a 63% upside move after price held above its breakout base. Later, in early October 2025, TRAC broke out from a right-angled descending broadening wedge pattern. That move was followed by a reclaim of the 200-day moving average and ultimately led to a powerful 113% rally.
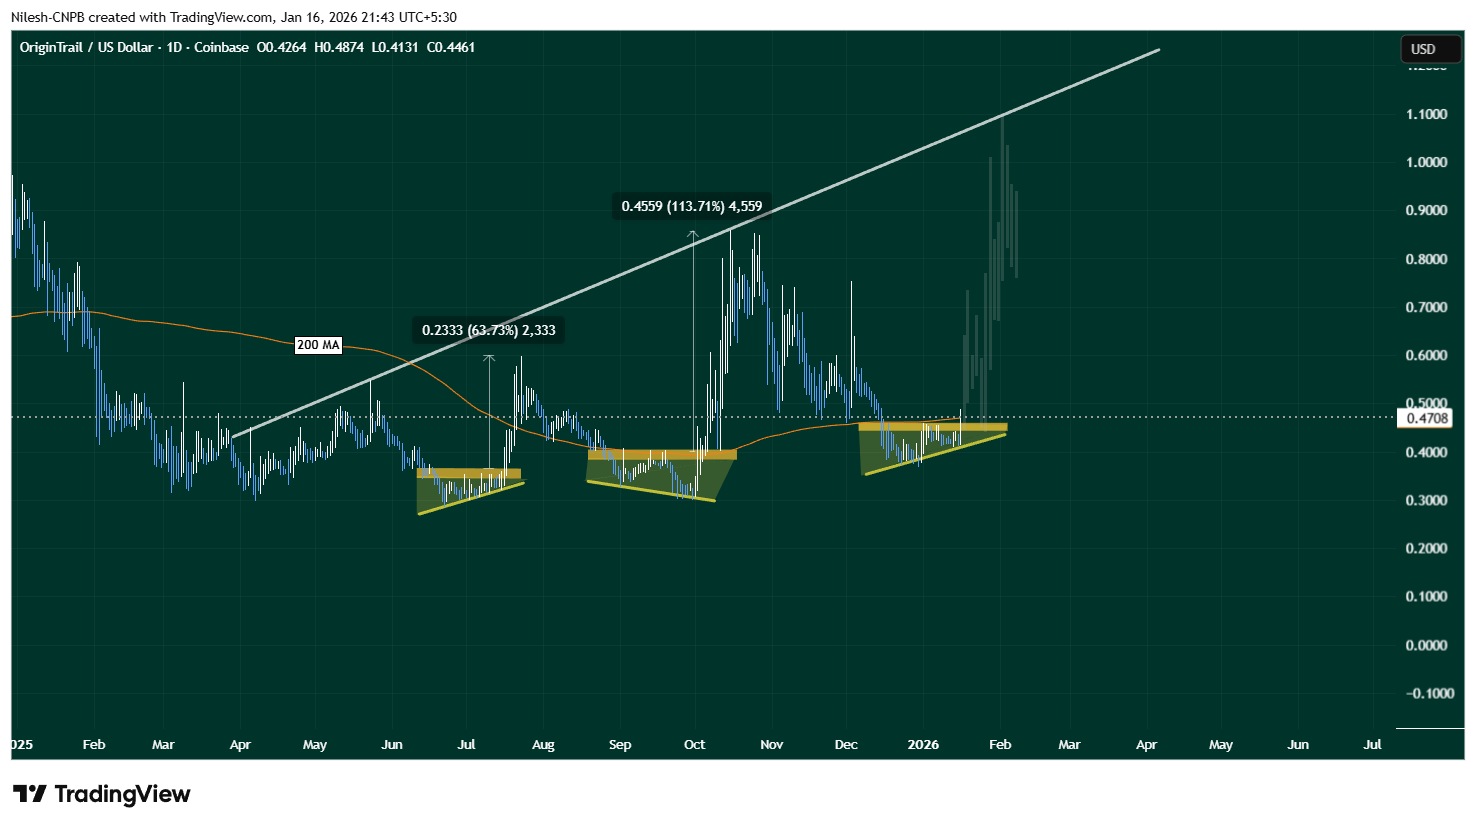
OriginTrail (TRAC) Daily Chart/Coinsprobe (Source: Tradingview)
The current setup shares key characteristics with those earlier moves. Price compression, a clean breakout, and interaction with the 200-day MA suggest that TRAC may once again be transitioning from consolidation into expansion.
What’s Next for TRAC?
If this fractal breakout plays out as expected, holding the $0.44–$0.46 zone as support will be crucial. A sustained hold above this range, along with continued strength above the 200-day moving average, could act as a launchpad for further upside.
In that scenario, TRAC may attempt a move toward its long-term ascending resistance trendline, which currently sits above the $1.00 level. A push toward that zone would align closely with the magnitude of prior fractal-driven rallies seen on the chart.
That said, fractal patterns are never guarantees. Broader market conditions, liquidity, and overall sentiment will continue to influence price action. A failure to hold the $0.44–$0.46 support zone or a rejection back below the 200-day moving average could invalidate the breakout and weaken the bullish fractal thesis.
Bottom Line
TRAC is showing early signs of another technically significant breakout, supported by historical fractal behavior and a reclaim of a key long-term moving average. If buyers can defend the current support zone, the chart suggests that OriginTrail may be positioning itself for a larger upside move in the weeks ahead.
Disclaimer: The views and analysis presented in this article are for informational purposes only and reflect the author’s perspective, not financial advice. Technical patterns and indicators discussed are subject to market volatility and may or may not yield the anticipated results. Investors are advised to exercise caution, conduct independent research, and make decisions aligned with their individual risk tolerance.
About Author: Nilesh Hembade is the Founder and Lead Author of Coinsprobe, with over 5 years of experience in the cryptocurrency and blockchain industry. Since launching Coinsprobe in 2023, he has been providing daily, research-driven insights through in-depth market analysis, on-chain data, and technical research.
Disclaimer: The information on this page may come from third parties and does not represent the views or opinions of Gate. The content displayed on this page is for reference only and does not constitute any financial, investment, or legal advice. Gate does not guarantee the accuracy or completeness of the information and shall not be liable for any losses arising from the use of this information. Virtual asset investments carry high risks and are subject to significant price volatility. You may lose all of your invested principal. Please fully understand the relevant risks and make prudent decisions based on your own financial situation and risk tolerance. For details, please refer to
Disclaimer.
Related Articles
Bitcoin ETFs Shed Nearly $300M as Risk-Off Pressure Builds Across Markets
U.S. spot Bitcoin ETFs experienced approximately $296 million in net outflows from March 24 to March 27 due to growing market risk aversion amidst geopolitical and macroeconomic pressures, indicating broader investor de-risking trends.
CryptoNewsFlash17m ago
XRP Price News: On-Chain Outflows Surge, Possibly Signaling Potential Demand; XRP’s April Average Return Rate Is About 24.8%
XRP has been weak over the past 24 hours, falling more than 2%. Despite the short-term pullback, its on-chain activity and withdrawal transaction volume have rebounded, suggesting investors’ long-term willingness to hold the asset. Analysis indicates that seasonal factors may present an opportunity for XRP to move higher, and traders should monitor outflow transaction dynamics to gauge its future direction.
GateNews19m ago
Bitcoin Floor Models Point to a Potential Bottom Near $46K as Capital Weakens
Bitcoin's onchain models indicate a potential bottom between $46,000 and $54, according to analyst Willy Woo. While historical support remains, declining capital raises concerns about the model's reliability amid changing market conditions.
CryptoNewsFlash22m ago
17.83% Plunge for TWT: What Traders Should Know
Trust Wallet Token (TWT) experienced a rapid 17.83% drop in just 15 minutes, reflecting broader market volatility. With trading volume at $4 million and mixed market signals, traders are monitoring key support and resistance levels for future direction.
Coinfomania34m ago
The Bitcoin Fear and Greed Index has fallen to 8, hitting a new low for the current cycle, with fear persisting for nearly 60 days. When will the market bottom out?
Bitcoin market sentiment remains depressed, and the Fear and Greed Index has fallen to 8. It has been at extreme fear for 59 days, mainly driven by high interest rates and the global economic environment. Despite retail traders’ low sentiment, long-term holders are still transferring assets. The market faces structural disagreement, and future price action will depend on changes in macro liquidity.
GateNews40m ago
Trump speaks out, combined with Iran calling for more, and the S&P 500 surged by $90 billion overnight
By the end of March 2026, due to remarks by Iran’s parliamentary speaker and comments by Trump that influenced the U.S. stock market sentiment, the U.S. stock market experienced volatility, and the S&P 500’s market capitalization rebounded by approximately $900 billion in the short term. The market is highly sensitive and responds noticeably to political statements. Despite the stock market rebound, oil prices remain high, and ongoing geopolitical impacts continue to attract investor attention; the future market trend will depend on the progress of negotiations.
GateNews40m ago
