
Hedera (HBAR) has been busy behind the scenes. FedEx has joined the Hedera Council, showing that large companies are getting involved.
Hedera was also featured in a World Economic Forum session on responsible AI, placing it in wider global talks. However, Hashgraph picked up a DEVIES Award for its work on HashSphere.
Despite all that, the HBAR price is trading around $0.098, and the chart still shows a cautious structure.
- Here’s What The Hedera Chart Is Showing
- What the Indicators Are Showing
- Hedera Price Targets to Watch This Week
Here’s What The Hedera Chart Is Showing
On the 4H chart, HBAR has been in a steady downtrend for months. Price kept printing lower highs and slowly sliding from the $0.18–$0.20 area down toward the recent low near $0.072.
After touching that low, the HBAR price bounced and is now hovering just under the $0.10 mark. The chart looks more like a pause after a long drop than a real breakout.
Price is moving sideways between $0.095 and $0.10. That range is where buyers and sellers are fighting right now.
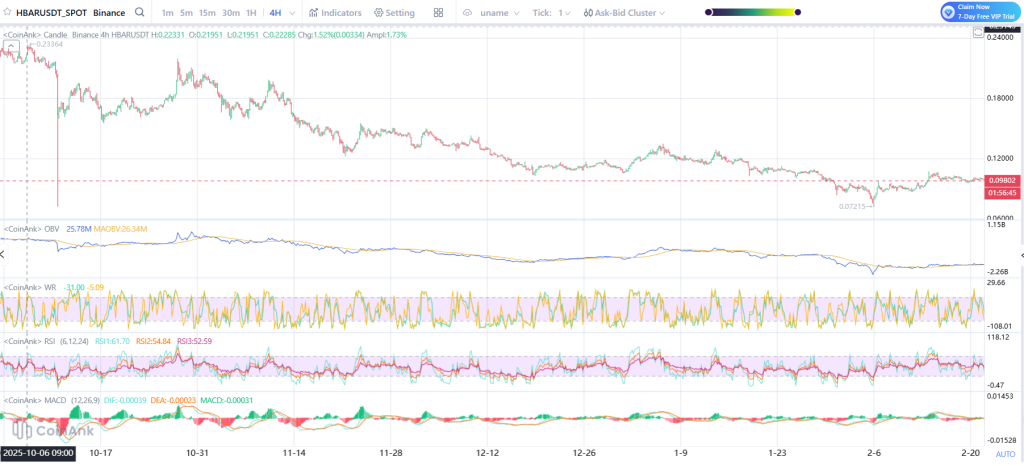
Source: Coinank
What the Indicators Are Showing
OBV has flattened after trending down for weeks. This implies that the selling pressure has eased, but the strong buying force has not yet fully come back.
The Williams %R indicator is currently close to the middle area, indicating that HBAR is not significantly oversold or overbought. The RSI is also close to the middle area, confirming the previous statement.
The MACD indicator is close to the zero level with small histogram bars. This typically indicates that the momentum is weak and the market is awaiting a signal. However, the HBAR price is stable, but there is no strong force yet.
_****Here’s Where Ripple’s XRP Price Could Be Headed This New Week**
Hedera Price Targets to Watch This Week
If HBAR stays above $0.095 and moves up, $0.11 is the first level to watch. After that, $0.12 is the next area where price struggled before.
If the buying interest is able to overcome the $0.12 level, a move towards $0.14 may be expected.
However, failure to hold above $0.095 could see the HBAR price could return towards $0.085, with the stronger level at $0.072 yet to be tested.
For now, HBAR is trading in a tight range. A decisive break above $0.11 or below $0.095 is likely to determine just how high, or how low, Hedera will go this week.
Disclaimer: The information on this page may come from third parties and does not represent the views or opinions of Gate. The content displayed on this page is for reference only and does not constitute any financial, investment, or legal advice. Gate does not guarantee the accuracy or completeness of the information and shall not be liable for any losses arising from the use of this information. Virtual asset investments carry high risks and are subject to significant price volatility. You may lose all of your invested principal. Please fully understand the relevant risks and make prudent decisions based on your own financial situation and risk tolerance. For details, please refer to
Disclaimer.
Related Articles
Bitcoin Tapped $69K, Oil Prices Ended March With 60% Surge: Market Watch
Bitcoin jumped to a new multi-day peak of over $69,200 earlier today as the markets prepare for Trump’s highly anticipated speech on the war against Iran.
Most larger-cap alts are also in the green, with ETH climbing past $2,100 and XRP defending the $1.30 support. ZEC and HBAR have posted the
CryptoPotato7m ago
BTC’s trading price is 21% above the realized price, the lowest premium level in the past three years
Gate News, April 1, BTC’s current trading price is 21% higher than its realized price (the average purchase cost of all circulating BTC). Data shows that BTC’s realized price is $54,286, and the current premium level is the lowest in the past three years, with a premium performance close to the historical cycle’s bottom-range behavior.
GateNews13m ago
Can this rebound in U.S. stocks hold up? The last day of Q1 surged 3% to close, but over the past month it’s crashed 5%.
March 31 saw a sharp jump in the three major U.S. stock indexes, with the Dow surging by more than 1,125 points and posting its best single-day performance. However, the S&P 500 fell 5.09% for the month of March, the worst performance since 2022, and market confidence remained weak. The VIX volatility index stayed elevated, suggesting investors are still on high alert. Soaring oil prices weighed on Asian markets; in March, capital outflows totaled $52 billion, with Taiwan hit the hardest. As the April earnings reporting season approaches, the market’s outlook remains unclear.
動區BlockTempo20m ago
Peter Schiff Updates His Gold Price Prediction for April
Gold just closed its worst month since 2008. In march, we saw gold had heavy dips, with prices falling into the low $4,000s before a dramatic reversal. But in the last week of the month, gold caught fire, rallying nearly 15 percent from the March 23 bottom. Now, the gold price is
CaptainAltcoin1h ago
