
The Aster price has been stuck in a tight range for weeks, but that quiet period may not last much longer.
Top analyst Ardi pointed out that the token is in its longest consolidation phase ever. In fact, the chart shows that the token has been trading sideways for close to three weeks.
Instead of the token trading up or down, it has been trading in a tight range, repeatedly testing support without breaking it. At writing, the ASTER token is trading at around $0.71.
Here’s What The ASTER Chart Is Showing
The chart shared by trader Ardi shows that ASTER has been defending a key support area around $0.69–$0.70. Several quick dips into that zone were immediately bought up, which suggests buyers are still active at those levels.
Another detail standing out in the ASTER chart is declining trading volume during the consolidation. That type of behavior often appears when markets are quietly building positions before the next move.
Instead of aggressive buying or selling, traders appear to be waiting. According to the analyst, that combination of stable support and shrinking volume can signal a local accumulation phase.
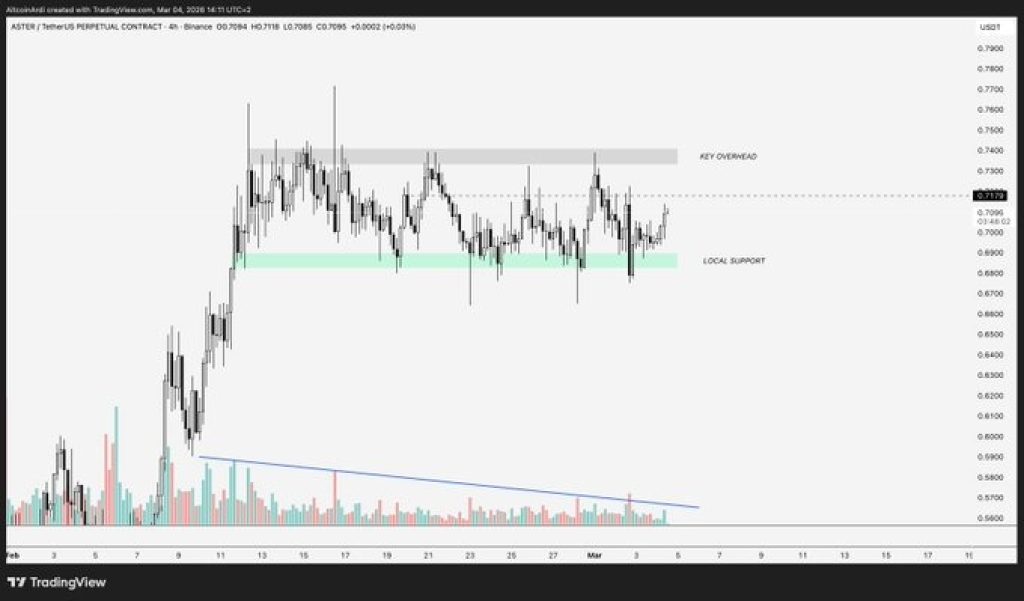
Source: X/Ardi
However, on the upside, the most important level sits around $0.75.That area has acted as a ceiling multiple times during the past few weeks, stopping each rally attempt before it could extend higher.
If the ASTER price manages to break above that level with strong momentum, the next target could come near $0.81, which the analyst describes as a larger macro pivot on the chart.
A move into that region would mark a clear shift in market structure after weeks of sideways action.
_****Pi Coin Price Prediction As Pi Network Prepares Major Upgrade Ahead Of Pi Day**
What’s Next For ASTER?
However, the setup cuts both ways. The longer a market stays trapped in a tight range, the more pressure tends to build. When the breakout finally happens, the move often happens quickly.
If the ASTER price fails to hold the $0.69 support zone, the analyst warns that the downside reaction could be sharp. After weeks of buyers entering the same area, a breakdown could push many of those positions underwater at the same time.
Such a situation may lead to forced selling and drive prices lower.For now, ASTER price remains stuck in a tight range between $0.69-$0.70 support and $0.75 resistance. We’re waiting to see which level will be broken first. Because after three weeks of silence, the next move may not stay quiet for long.
Disclaimer: The information on this page may come from third parties and does not represent the views or opinions of Gate. The content displayed on this page is for reference only and does not constitute any financial, investment, or legal advice. Gate does not guarantee the accuracy or completeness of the information and shall not be liable for any losses arising from the use of this information. Virtual asset investments carry high risks and are subject to significant price volatility. You may lose all of your invested principal. Please fully understand the relevant risks and make prudent decisions based on your own financial situation and risk tolerance. For details, please refer to
Disclaimer.
Related Articles
PEPE Price at $0.053259 as Tight Range and Falling Volume Shape Short-Term Market Activity
PEPE was traded at $0.053259 and has recorded a 3.0 percent fall in value but it is within a thin band of support and resistance.
The market exhibited a volume of 235.15M in 24 hour trading, which is a decline of 19.16% reflecting less trading activity.
Technical indicators are not
CryptoNewsLand3m ago
XRP ETF Performance Praised as 'Really Impressive' by Bloomberg - U.Today
XRP ETFs have shown resilience amid a 45% price drop, attracting significant capital despite typical market behavior. Bloomberg's Eric Balchunas highlights strong investor support. Despite recent outflows, the funds retain substantial assets, indicating community dedication.
UToday23m ago
Crypto Shines Amid Middle East Oil Shock and Market Selloff
Bitcoin remains stable amid market turmoil fueled by rising oil prices and inflation, outperforming traditional assets. Its reduced leverage limits forced selling, attracting long-term investors eyeing potential gains in a volatile landscape.
CryptoFrontNews29m ago
XRP Holds $1.34 Support While Leverage Heatmap Highlights $1.30 Risk Zone
XRP is trading at $1.36 in a tight range of support at $1.34 and resistance at $1.37.
The heatmap data indicates that there is a huge amount of long positions in the range of $1.30.
Should prices fall to around $1.30, long positions with high leverage in this region might
CryptoNewsLand1h ago
ETH drops 1.07% in 15 minutes: whale fund concentration triggers short-term pullback
March 10, 2026, 18:00 to 18:15 (UTC), ETH's return within the 15-minute candlestick was -1.07%, with price fluctuations ranging from 2049.1 to 2073.15 USDT, an amplitude of 1.16%. During the same period, market trading volume significantly increased by over 32%, large on-chain fund flows occurred frequently, triggering short-term market sentiment fluctuations, rapidly increasing attention, and intensifying volatility risks.
The main driver of this abnormal movement is the concentrated sell-off by whale funds. On-chain data shows that within this time window, there were four large transfers exceeding 5000 ETH, all flowing to a major...
GateNews1h ago
BTC 15-minute decline of 0.70%: On-chain large transfers and macro bearish signals resonate, triggering short-term selling pressure
From 18:00 to 18:15 (UTC) on March 10, 2026, BTC experienced a significant price fluctuation, with a 15-minute return of -0.70%. The price range was 70366.3-70915.0 USDT, with an amplitude of 0.77%. During the same period, trading volume increased by 18% compared to the previous hour's average, and the order book depth temporarily narrowed, indicating increased market volatility and heightened attention.
The main drivers of this fluctuation were multiple large on-chain fund transfers and macro news resonance. Between 18:03 and 18:12, there were several on-chain transactions exceeding 500
GateNews1h ago